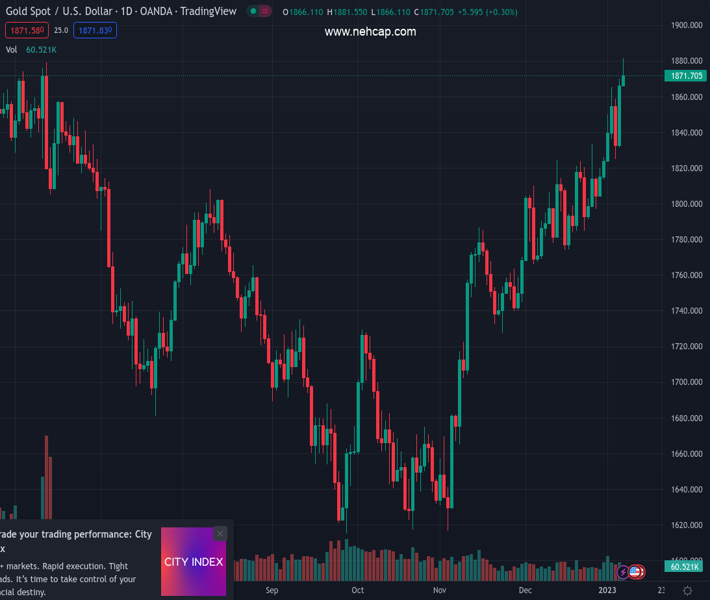
#XAUUSD @ 1,870.52 Gold price retreats after refreshing eight-month high, lacks follow through., @nehcap view: Pullback expected (Pivot Orderbook analysis)
…
This is a premium post.
[s2If !current_user_can(access_s2member_level4)]Please register for PREMIUM VERSION HERE to read full post below containing analysis. In case of any error or you think you are not able to read the full post below, please email us at support#nehcap.com [lwa][/s2If] [s2If current_user_can(access_s2member_level4)]
- Gold price retreats after refreshing eight-month high, lacks follow through.
- Federal Reserve officials tried to defend US Dollar and probed XAU/USD bulls.
- China-linked optimism, previous United Stated data allowed Gold price to stay firmer.
- Light calendar ahead of US, China Inflation can probe XAU/USD traders, Fed Chair Powell eyed for intraday moves.
The pair currently trades last at 1870.52.
The previous day high was 1869.91 while the previous day low was 1830.62. The daily 38.2% Fib levels comes at 1854.9, expected to provide support. Similarly, the daily 61.8% fib level is at 1845.63, expected to provide support.
Gold price (XAU/USD) seems running out of upside momentum as it retreats to $1,871, after renewing the multi-day high amid the mostly quiet week-start trading. That said, the United States economics and China’s reopening appeared to have previously helped the XAU/USD to rise to the highest level since May 2022. However, comments from the Federal Reserve (Fed) officials appear to challenge the Gold bulls afterward.
Last week’s United States economics, mainly concerning the wage growth and ISM Services PMI for December, raised speculations that the Federal Reserve (Fed) finally has an upper hand in taming inflation, suggesting a pause to aggressive rate hikes. The same weighed on the US Treasury bond yields and the US Dollar even as the latest comments from the Fed officials restrict the Greenback’s latest downside.
That said, Atlanta Federal Reserve bank president Raphael Bostic said on Monday that it is ”fair to say that the Fed is willing to overshoot.” On the same line, San Francisco Federal Reserve Bank President Mary Daly stated that they are determined, united, resolute to bring inflation down. Additionally, the Federal Reserve Bank of New York’s monthly Survey of Consumer Expectations showed on Monday that the US consumers’ one-year inflation expectation declined to 5% in December from 5.2% prior. Alternatively, the three-year ahead expected inflation remained unchanged at 3% and the five-year ahead expected inflation edged higher to 2.4% from 2.3%.
Hence, the Federal Reserve officials’ defense of the hawkish monetary policy actions weighs on the Gold prices.
China’s reopening of the international borders after a three-year halt joined the People’s Bank of China’s (PBOC) quest for more Gold reserves to underpin the XAU/USD upside the previous day. The reason could be linked to the dragon nation’s status as one of the world’s biggest gold consumers. That said, Beijing’s readiness for stimulus and early signals of shopping spree ahead of the Chinese New Year holiday season also seemed to have favored the Gold’s upside. It’s worth noting that a lack of major data and events from elsewhere also allowed Chinese catalysts to gain major attention.
Moving on, Gold traders are likely to witness further hardships amid a lack of major catalysts ahead of Thursday’s United States Consumer Price Index (CPI) for December. However, comments from the various Federal Reserve (Fed) officials may offer intermediate moves. It’s worth observing that Tuesday’s speech from Fed Chair Jerome Powell will be crucial for XAU/USD traders considering the latest shift in the United States data and the market’s bias for the US central bank’s next move.
Gold buyers managed to poke June 2022 high surrounding $1,880 while extending the bounce off one-month-old horizontal support the previous day. However, nearly overbought conditions of the Relative Strength Index (RSI) line, placed at 14, joined an upward-sloping trend line from December 27 to restrict the metal’s further upside.
Also challenging the XAU/USD buyers was the receding bullish bias of the Moving Average Convergence and Divergence (MACD) indicator.
As a result, Gold’s pullback towards the previous weekly top surrounding $1,865 appears imminent.
However, a fortnight-long ascending support line, close to $1,838 by the press time, could challenge the XAU/USD sellers afterward.
In a case where the Gold price fails to rebound from $1,838, the aforementioned horizontal support near $1,823 and the 100-Simple Moving Average (SMA) level surrounding $1,818 will gain the market’s attention.
Alternatively, the $1,880 level and ascending trend line from early December 2022, around $1,883 restricts the short-term upside of the Gold price.
Following that, highs marked during May 2022 and late April, close to $1,910 and $1,920 in that order, could challenge the Gold buyers.
Trend: Pullback expected
Technical Levels: Supports and Resistances
XAUUSD currently trading at 1871.88 at the time of writing. Pair opened at 1866.99 and is trading with a change of 0.26% % .
| Overview | Overview.1 | |
|---|---|---|
| 0 | Today last price | 1871.88 |
| 1 | Today Daily Change | 4.89 |
| 2 | Today Daily Change % | 0.26% |
| 3 | Today daily open | 1866.99 |
The pair remains strongly bullish on the daily timeframe. It trades above its 20 SMA @ 1812.3, 50 SMA 1768.68, 100 SMA @ 1726.95 and 200 SMA @ 1778.09.
| Trends | Trends.1 | |
|---|---|---|
| 0 | Daily SMA20 | 1812.30 |
| 1 | Daily SMA50 | 1768.68 |
| 2 | Daily SMA100 | 1726.95 |
| 3 | Daily SMA200 | 1778.09 |
The previous day high was 1869.91 while the previous day low was 1830.62. The daily 38.2% Fib levels comes at 1854.9, expected to provide support. Similarly, the daily 61.8% fib level is at 1845.63, expected to provide support.
Note the levels of interest below:
- Pivot support is noted at 1841.77, 1816.55, 1802.48
- Pivot resistance is noted at 1881.06, 1895.13, 1920.35
| Levels | Levels.1 |
|---|---|
| Previous Daily High | 1869.91 |
| Previous Daily Low | 1830.62 |
| Previous Weekly High | 1869.91 |
| Previous Weekly Low | 1823.76 |
| Previous Monthly High | 1833.38 |
| Previous Monthly Low | 1765.89 |
| Daily Fibonacci 38.2% | 1854.90 |
| Daily Fibonacci 61.8% | 1845.63 |
| Daily Pivot Point S1 | 1841.77 |
| Daily Pivot Point S2 | 1816.55 |
| Daily Pivot Point S3 | 1802.48 |
| Daily Pivot Point R1 | 1881.06 |
| Daily Pivot Point R2 | 1895.13 |
| Daily Pivot Point R3 | 1920.35 |
[/s2If]
Join Our Telegram Group
")


