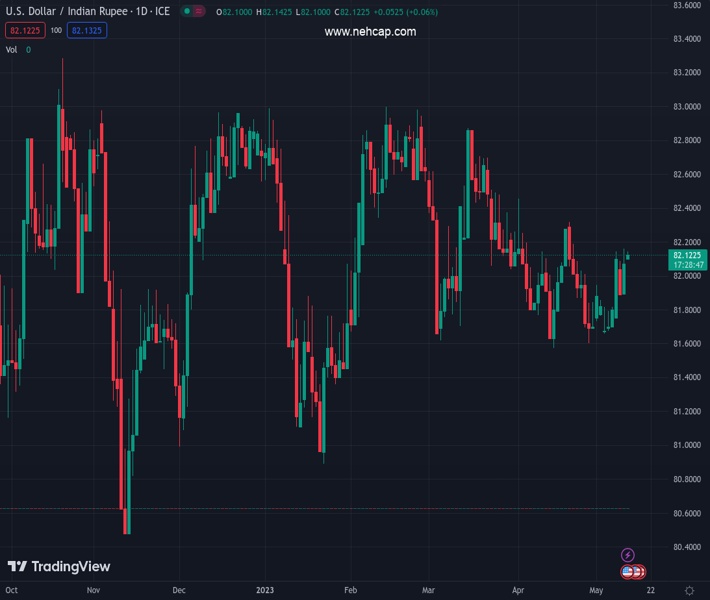
#USDINR @ 82.1250 retreats from three-week high while paring the biggest weekly gain in two months. (Pivot Orderbook analysis)
…
This is a premium post.
[s2If !current_user_can(access_s2member_level4)]Please register for FREE REGISTER to read full post below containing analysis. In case of any error or you think you are not able to read the full post below, please email us at support#nehcap.com [lwa][/s2If] [s2If current_user_can(access_s2member_level1)]
- USD/INR retreats from three-week high while paring the biggest weekly gain in two months.
- Downbeat Oil price joins market’s reassessment of risk catalysts to trigger Indian Rupee bounce from multi-day low.
- India CPI, output data precedes US Michigan CSI and Inflation Expectation to decorate economic calendar.
- Comparatively more hawkish Fed, challenges to risk appetite favor USD/INR bulls.
The pair currently trades last at 82.1250.
The previous day high was 82.19 while the previous day low was 81.8775. The daily 38.2% Fib levels comes at 82.0707, expected to provide support. Similarly, the daily 61.8% fib level is at 81.9969, expected to provide support.
USD/INR prints mild losses around 82.10 as it consolidates the biggest weekly gains since March ahead of the key statistics from India and the US, up for publishing during Friday’s European session. In doing so, the Indian Rupee (INR) pair also takes clues from the softer Oil price and the market’s cautious optimism.
Oil price remains pressured near $70.40, down for the third consecutive day as economic fears join the firmer US Dollar to weigh on the commodity prices. That said, recently downbeat inflation data from China, the world’s biggest commodity user, join the looming fears of US default and banking fallouts to exert downside pressure on the black gold prices. It should be noted that India’s heavy reliance on energy imports and record-high deficit keep the INR vulnerable to Oil price moves.
US Dollar Index (DXY) retreats from a one-week high to 102.00 after posting the biggest daily gains in two months the previous day despite mostly downbeat prints of the US data. That said, the US Producer Price Index (PPI) improved to 0.2% MoM for April versus 0.3% expected and -0.4% prior. More importantly, PPI ex Food & Energy, known as Core PPI, rose on MoM but eased on YoY. Further, US Initial Jobless Claims rose by 264,000 to push the level to the highest level since October 2021.
Despite the unimpressive data, Minneapolis Fed President Neel Kashkari mentioned on Thursday that inflation has eased but warned it is above the Fed’s 2% target.
Recently escalating market fears surrounding the US debt ceiling expiry and banking fallouts, seem to allow the US Dollar Index to brace for the first weekly gain in three while pushing down the US Treasury bond yields for the third consecutive week. It should be noted that the postponement of the debt ceiling talks between US President Joe Biden and House Speaker McCarthy and a slump in the share price of PacWest Bancorp appear the main negative developments to weigh on the sentiment. Additionally, warnings from US Treasury Secretary Janet Yellen and Beth Hammack, Chair of the Treasury Borrowing Advisory Committee and Co-Head of Goldman’s Global Financing Group, about US default, also threaten the risk profile.
Amid these plays, the US stock futures print mild gains while the Asia-Pacific equities grind higher amid downbeat US Treasury bond yields.
Moving on, India’s Consumer Price Index (CPI) for April and various Output figures for March will precede the US University of Michigan’s (UoM) Consumer Sentiment Index (CSI) for May, as well as the UoM 5-year Consumer Inflation Expectations for the said month, to direct USD/INR moves.
Given the likely easing in the inflation pressure in India, coupled with the comparatively hawkish Fed bias of the Reserve Bank of India (RBI), the USD/INR may witness further upside in a case where the scheduled data match the market consensus.
A clear upside break of the two-month-old resistance line, now immediate support near 82.00, favors the USD/INR buyers. However, a downward-sloping trend line stretched from early April, near 82.30 at the latest, restricts the short-term upside of the Indian Rupee pair.
Technical Levels: Supports and Resistances
USDINR currently trading at 82.1245 at the time of writing. Pair opened at 82.1396 and is trading with a change of -0.02% % .
| Overview | Overview.1 | |
|---|---|---|
| 0 | Today last price | 82.1245 |
| 1 | Today Daily Change | -0.0151 |
| 2 | Today Daily Change % | -0.02% |
| 3 | Today daily open | 82.1396 |
The pair is trading above its 20 Daily moving average @ 81.9122, above its 50 Daily moving average @ 82.0663 , below its 100 Daily moving average @ 82.1579 and above its 200 Daily moving average @ 81.6872
| Trends | Trends.1 | |
|---|---|---|
| 0 | Daily SMA20 | 81.9122 |
| 1 | Daily SMA50 | 82.0663 |
| 2 | Daily SMA100 | 82.1579 |
| 3 | Daily SMA200 | 81.6872 |
The previous day high was 82.19 while the previous day low was 81.8775. The daily 38.2% Fib levels comes at 82.0707, expected to provide support. Similarly, the daily 61.8% fib level is at 81.9969, expected to provide support.
Note the levels of interest below:
- Pivot support is noted at 81.948, 81.7565, 81.6355
- Pivot resistance is noted at 82.2606, 82.3816, 82.5731
| Levels | Levels.1 |
|---|---|
| Previous Daily High | 82.1900 |
| Previous Daily Low | 81.8775 |
| Previous Weekly High | 81.9525 |
| Previous Weekly Low | 81.6435 |
| Previous Monthly High | 82.5092 |
| Previous Monthly Low | 81.4850 |
| Daily Fibonacci 38.2% | 82.0707 |
| Daily Fibonacci 61.8% | 81.9969 |
| Daily Pivot Point S1 | 81.9480 |
| Daily Pivot Point S2 | 81.7565 |
| Daily Pivot Point S3 | 81.6355 |
| Daily Pivot Point R1 | 82.2606 |
| Daily Pivot Point R2 | 82.3816 |
| Daily Pivot Point R3 | 82.5731 |
[/s2If]
Nehcap Expert Advisor
The NEHCAP MT4 EA is high quality professional trading system geared to generate returns without using GRID or martingales. Each trade has strict risk per trade parameter. The pairs under management include EURUSD, GBPUSD, AUDCAD, AUDNZD,GBPAUD, EURAUD, EURCAD, CHFJPY and many more.
The system is trading live: LIVE ACCOUNT TRACKING
You can run it free. Apply for a free trial and track our account. Buy the system or use profit share mechanism to generate returns on your MT4.
Join Our Telegram Group
")


