#XAGUSD @ 22.584 Silver continues losing ground for the second straight day and drops to a fresh weekly low.
…
This is a premium post.
[s2If !current_user_can(access_s2member_level4)]Please register for FREE REGISTER to read full post below containing analysis. In case of any error or you think you are not able to read the full post below, please email us at support#nehcap.com [lwa][/s2If] [s2If current_user_can(access_s2member_level1)]
- Silver continues losing ground for the second straight day and drops to a fresh weekly low.
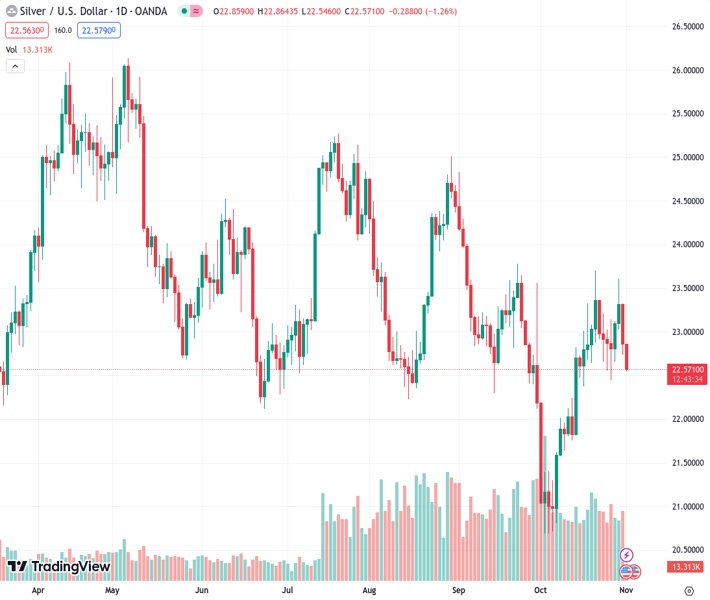
The pair currently trades last at 22.584.
The previous day high was 23.33 while the previous day low was 22.74. The daily 38.2% Fib levels comes at 22.96, expected to provide resistance. Similarly, the daily 61.8% fib level is at 23.1, expected to provide resistance.
Silver (XAG/USD) remains under heavy selling pressure for the second successive day on Wednesday and hits a fresh weekly low during the early part of the European session. The white metal currently trades around the $22.60-$22.55 area, down 1.30% for the day, and seems vulnerable to extending its descending trend.
From a technical perspective, the recent repeated failures to find acceptance above the 200-day Simple Moving Average (SMA) and rejections near the $23.60-$23.70 supply zone constitute the formation of a bearish multiple tops pattern. This, along with the fact that oscillators on the daily chart have again started gaining negative traction, suggests that the path of least resistance for the XAG/USD is to the downside.
Some follow-through selling below last week’s swing low, around the $22.45 region, will reaffirm the bearish bias and pave the way for deeper losses. The XAG/USD might then fall to the $22.00 mark before dropping to the $21.70 horizontal support zone and the $21.35-$21.30 region. The downward trajectory could drag the white metal further towards the $21.00 mark en route to the $20.70-$20.65 area, or a seven-month low touched in October.
On the flip side, the $22.75-$22.80 congestion zone now seems to act as an immediate hurdle ahead of the $23.00 round figure. The next relevant hurdle is pegged near the $23.25 region, or the 200-day SMA, above which the XAG/USD could make a fresh attempt to clear the $23.60-$23.70 strong barrier. A convincing breakout through will be seen as a fresh trigger for bullish traders and set the stage for additional gains.
Technical Levels: Supports and Resistances
XAGUSD currently trading at 22.58 at the time of writing. Pair opened at 22.88 and is trading with a change of -1.31 % .
| Overview | Overview.1 | |
|---|---|---|
| 0 | Today last price | 22.58 |
| 1 | Today Daily Change | -0.30 |
| 2 | Today Daily Change % | -1.31 |
| 3 | Today daily open | 22.88 |
The pair is trading above its 20 Daily moving average @ 22.47, below its 50 Daily moving average @ 22.96 , below its 100 Daily moving average @ 23.23 and below its 200 Daily moving average @ 23.29
| Trends | Trends.1 | |
|---|---|---|
| 0 | Daily SMA20 | 22.47 |
| 1 | Daily SMA50 | 22.96 |
| 2 | Daily SMA100 | 23.23 |
| 3 | Daily SMA200 | 23.29 |
The previous day high was 23.33 while the previous day low was 22.74. The daily 38.2% Fib levels comes at 22.96, expected to provide resistance. Similarly, the daily 61.8% fib level is at 23.1, expected to provide resistance.
Note the levels of interest below:
- Pivot support is noted at 22.63, 22.39, 22.04
- Pivot resistance is noted at 23.23, 23.58, 23.83
| Levels | Levels.1 |
|---|---|
| Previous Daily High | 23.33 |
| Previous Daily Low | 22.74 |
| Previous Weekly High | 23.36 |
| Previous Weekly Low | 22.44 |
| Previous Monthly High | 23.70 |
| Previous Monthly Low | 20.68 |
| Daily Fibonacci 38.2% | 22.96 |
| Daily Fibonacci 61.8% | 23.10 |
| Daily Pivot Point S1 | 22.63 |
| Daily Pivot Point S2 | 22.39 |
| Daily Pivot Point S3 | 22.04 |
| Daily Pivot Point R1 | 23.23 |
| Daily Pivot Point R2 | 23.58 |
| Daily Pivot Point R3 | 23.83 |
[/s2If]
Download Nehcap EAWe have two EAs that are operational on our LIVE accounts.
- EA-FIX: Check out the details here. Download EA-FIX . EA-FIX is a non-grid HFT scalper.
- EA-GROWTH: High quality low dd EA using trend grids. Download EA_GROWTHJoin Our Telegram Group
")


