#EURUSD @ 1.05701 could revisit the previous week’s low at 1.0521 due to facing pressure.
…
This is a premium post.
[s2If !current_user_can(access_s2member_level4)]Please register for FREE REGISTER to read full post below containing analysis. In case of any error or you think you are not able to read the full post below, please email us at support#nehcap.com [lwa][/s2If] [s2If current_user_can(access_s2member_level1)]
- EUR/USD could revisit the previous week’s low at 1.0521 due to facing pressure.
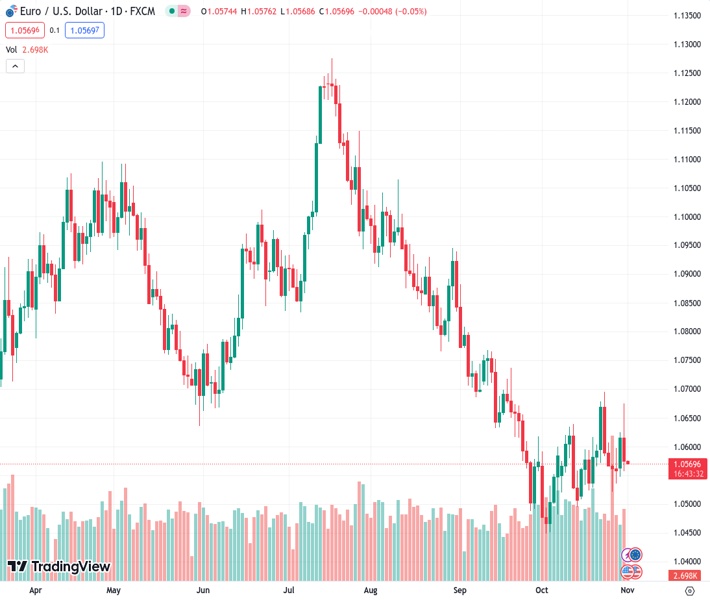
The pair currently trades last at 1.05701.
The previous day high was 1.0675 while the previous day low was 1.0558. The daily 38.2% Fib levels comes at 1.0602, expected to provide resistance. Similarly, the daily 61.8% fib level is at 1.063, expected to provide resistance.
EUR/USD consolidates ahead of the Federal Open Market Committee (FOMC) policy decision with the expectation of maintaining the current interest rate at 5.5% in November’s meeting. The pair trades lower near 1.0570 during the Asian session on Wednesday.
The Eurozone Harmonised Index of Consumer Prices (HICP) exhibited a significant slowdown in a report released on Tuesday, dropping from an annual pace of 4.3% to 2.9% in October. This notable deceleration in consumer prices aligns with market expectations that the European Central Bank (ECB) is unlikely to pursue further interest rate hikes. Additionally, the looming risks of a recession may persist in undermining the EUR/USD pair.
The EUR/USD pair could find support around the psychological level of 1.0550, followed by the previous week’s low at 1.0521. If the pair convincingly breaches the latter, it could pave the way for further downside movement towards the critical level around 1.0500.
The Moving Average Convergence Divergence (MACD) line positions below the centerline but above the signal line implying a potential shift in momentum. This nuanced market sentiment suggests a mix of factors indicating a potential change in the prevailing trend.
Investors will closely watch the Federal Open Market Committee’s (FOMC) post-meeting communication to gauge the potential path of interest rates. Any dovish remarks could turn the pair to the upside toward the key barrier around the 23.6% Fibonacci retracement level at 1.0648. The further obstacles are presented by the 50-day Exponential Moving Average (EMA) at 1.0650.
A successful breach above the mentioned resistance levels could potentially invigorate the EUR/USD pair to revisit October’s high at the 1.0694 level.
However, the EUR/USD pair seems to be facing restrained momentum as the 14-day Relative Strength Index (RSI) lies below the 50 level, suggesting bearish momentum and reflecting a bias towards a weaker market sentiment.
Technical Levels: Supports and Resistances
EURUSD currently trading at 1.057 at the time of writing. Pair opened at 1.0576 and is trading with a change of -0.06 % .
| Overview | Overview.1 | |
|---|---|---|
| 0 | Today last price | 1.0570 |
| 1 | Today Daily Change | -0.0006 |
| 2 | Today Daily Change % | -0.0600 |
| 3 | Today daily open | 1.0576 |
The pair remains strongly bearish on the daily time frame. It trades below the 20 SMA @ 1.0573, 50 SMA 1.0649, 100 SMA @ 1.0815 and 200 SMA @ 1.0811.
| Trends | Trends.1 | |
|---|---|---|
| 0 | Daily SMA20 | 1.0573 |
| 1 | Daily SMA50 | 1.0649 |
| 2 | Daily SMA100 | 1.0815 |
| 3 | Daily SMA200 | 1.0811 |
The previous day high was 1.0675 while the previous day low was 1.0558. The daily 38.2% Fib levels comes at 1.0602, expected to provide resistance. Similarly, the daily 61.8% fib level is at 1.063, expected to provide resistance.
Note the levels of interest below:
- Pivot support is noted at 1.053, 1.0486, 1.0413
- Pivot resistance is noted at 1.0648, 1.072, 1.0765
| Levels | Levels.1 |
|---|---|
| Previous Daily High | 1.0675 |
| Previous Daily Low | 1.0558 |
| Previous Weekly High | 1.0695 |
| Previous Weekly Low | 1.0522 |
| Previous Monthly High | 1.0695 |
| Previous Monthly Low | 1.0448 |
| Daily Fibonacci 38.2% | 1.0602 |
| Daily Fibonacci 61.8% | 1.0630 |
| Daily Pivot Point S1 | 1.0530 |
| Daily Pivot Point S2 | 1.0486 |
| Daily Pivot Point S3 | 1.0413 |
| Daily Pivot Point R1 | 1.0648 |
| Daily Pivot Point R2 | 1.0720 |
| Daily Pivot Point R3 | 1.0765 |
[/s2If]
Download Nehcap EAWe have two EAs that are operational on our LIVE accounts.
- EA-FIX: Check out the details here. Download EA-FIX . EA-FIX is a non-grid HFT scalper.
- EA-GROWTH: High quality low dd EA using trend grids. Download EA_GROWTHJoin Our Telegram Group
")


