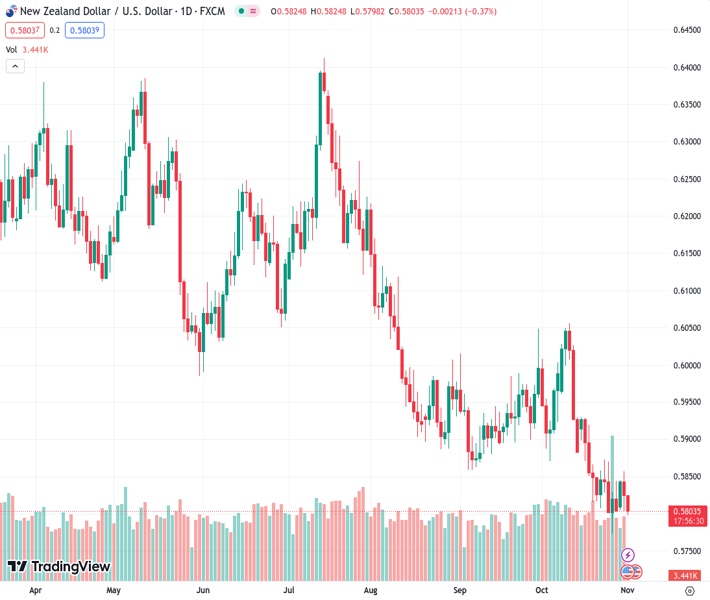
#NZDUSD @ 0.58038 drifts lower for the second straight day and is pressured by a combination of factors.
…
This is a premium post.
[s2If !current_user_can(access_s2member_level4)]Please register for FREE REGISTER to read full post below containing analysis. In case of any error or you think you are not able to read the full post below, please email us at support#nehcap.com [lwa][/s2If] [s2If current_user_can(access_s2member_level1)]
- NZD/USD drifts lower for the second straight day and is pressured by a combination of factors.
The pair currently trades last at 0.58038.
The previous day high was 0.5858 while the previous day low was 0.5803. The daily 38.2% Fib levels comes at 0.5824, expected to provide resistance. Similarly, the daily 61.8% fib level is at 0.5837, expected to provide resistance.
The NZD/USD pair remains under some selling pressure for the second straight day on Wednesday and slips below the 0.5800 mark during the Asian session, hitting a fresh weekly low in reaction to the disappointing Chinese data.
A Caixin-sponsored survey showed that business activity in China’s manufacturing sector contracted in October for the first time in three months. In fact, the Caixin China PMI fell from 50.6 the previous month to 49.5 in October, confirming the official figures released on Tuesday and fueling concerns about the worsening conditions in the world’s second-largest economy. This comes on top of dismal domestic employment figures and exerts additional downward pressure on the New Zealand Dollar (NZD).
Statistics New Zealand reported that the number of employed people unexpectedly fell by 0.2% during the third quarter and the jobless rate rose to 3.9% from 3.6%. This, in turn, suggests that the Reserve Bank of New Zealand (RBNZ) will keep its policy rate unchanged in November, which, along with a modest US Dollar (USD) strength, drags the NZD/USD pair lower. The USD bulls, however, seem reluctant to place aggressive bets and now look to the highly-anticipated FOMC monetary policy decision.
The Federal Reserve (Fed) is widely expected to maintain the status quo for the second time in a row. Investors, however, seem convinced that the US central bank will keep the door open for additional rate hikes to bring inflation back to the 2% target. Moreover, the US economic resilience should allow the Fed to stick to its hawkish stance. Hence, the accompanying policy statement and Fed Chair Jerome Powell’s comments at the post-meeting presser will be scrutinized for cues about the future rate-hike path.
The outlook, in turn, will play a key role in influencing the near-term USD price dynamics and help determine the next leg of a directional move for the NZD/USD pair. Heading into the key event risk, traders will confront the release of US macro data – the ADP report on private-sector employment, the ISM Manufacturing PMI and JOLTS Job Openings data – later during the early North American session. In the meantime, elevated US Treasury bond yields might continue to underpin the buck and weigh on the major.
Technical Levels: Supports and Resistances
NZDUSD currently trading at 0.5791 at the time of writing. Pair opened at 0.5825 and is trading with a change of -0.58 % .
| Overview | Overview.1 | |
|---|---|---|
| 0 | Today last price | 0.5791 |
| 1 | Today Daily Change | -0.0034 |
| 2 | Today Daily Change % | -0.5800 |
| 3 | Today daily open | 0.5825 |
The pair remains strongly bearish on the daily time frame. It trades below the 20 SMA @ 0.5896, 50 SMA 0.5916, 100 SMA @ 0.6029 and 200 SMA @ 0.6128.
| Trends | Trends.1 | |
|---|---|---|
| 0 | Daily SMA20 | 0.5896 |
| 1 | Daily SMA50 | 0.5916 |
| 2 | Daily SMA100 | 0.6029 |
| 3 | Daily SMA200 | 0.6128 |
The previous day high was 0.5858 while the previous day low was 0.5803. The daily 38.2% Fib levels comes at 0.5824, expected to provide resistance. Similarly, the daily 61.8% fib level is at 0.5837, expected to provide resistance.
Note the levels of interest below:
- Pivot support is noted at 0.5799, 0.5774, 0.5744
- Pivot resistance is noted at 0.5854, 0.5884, 0.5909
| Levels | Levels.1 |
|---|---|
| Previous Daily High | 0.5858 |
| Previous Daily Low | 0.5803 |
| Previous Weekly High | 0.5874 |
| Previous Weekly Low | 0.5772 |
| Previous Monthly High | 0.6056 |
| Previous Monthly Low | 0.5772 |
| Daily Fibonacci 38.2% | 0.5824 |
| Daily Fibonacci 61.8% | 0.5837 |
| Daily Pivot Point S1 | 0.5799 |
| Daily Pivot Point S2 | 0.5774 |
| Daily Pivot Point S3 | 0.5744 |
| Daily Pivot Point R1 | 0.5854 |
| Daily Pivot Point R2 | 0.5884 |
| Daily Pivot Point R3 | 0.5909 |
[/s2If]
Download Nehcap EAWe have two EAs that are operational on our LIVE accounts.
- EA-FIX: Check out the details here. Download EA-FIX . EA-FIX is a non-grid HFT scalper.
- EA-GROWTH: High quality low dd EA using trend grids. Download EA_GROWTHJoin Our Telegram Group
")


