#AUDNZD @ 1.09166 The spent most of Tuesday drifting lower before a late-day break buoyed the pair.
…
This is a premium post.
[s2If !current_user_can(access_s2member_level4)]Please register for FREE REGISTER to read full post below containing analysis. In case of any error or you think you are not able to read the full post below, please email us at support#nehcap.com [lwa][/s2If] [s2If current_user_can(access_s2member_level1)]
- The AUD/NZD spent most of Tuesday drifting lower before a late-day break buoyed the pair.
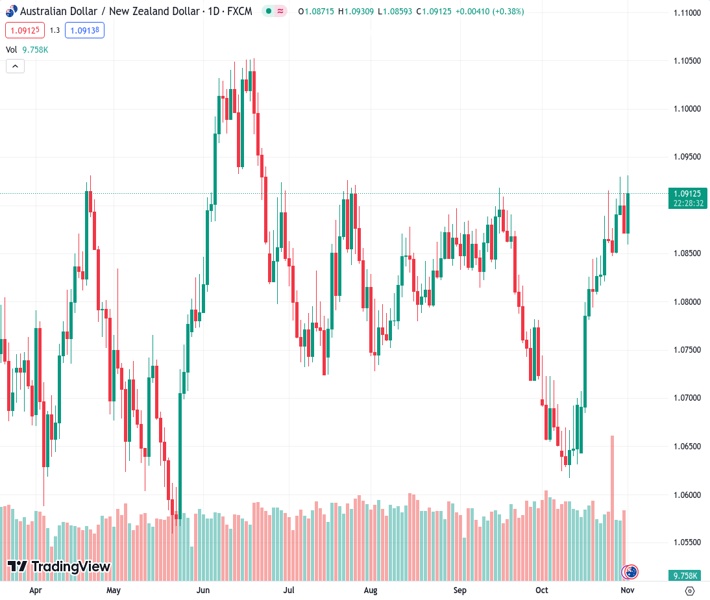
The pair currently trades last at 1.09166.
The previous day high was 1.093 while the previous day low was 1.09. The daily 38.2% Fib levels comes at 1.0918, expected to provide resistance. Similarly, the daily 61.8% fib level is at 1.0911, expected to provide support.
The AUD/NZD has bumped back over 1.0900 after the Kiwi (NZD) tripped and stumbled in early Wednesday market action, trading back down against the Aussie (AUD) and sending the AUD/NZD tipping back into a near-term high around 1.0930.
Aussie intraday declines sent the AUD/NZD back into the 200-hour Simple Moving Average (SMA) before the pair caught a rebound bid from the moving average.
The pair is trading back into the high end of recent action, but further upside remains limited for the AUD with long-term resistance piling up from the 1.0920 level.
On the down side, prices have been firmly cycling the 200-day SMA for most of the back half of 2023, and it won’t take much to push the Aussie back into a bearish pattern in a return to the long-run average.
Technical indicators are also running dry on the high side, with the Relative Strength Index (RSI) and Moving Average Convergence-Divergence (MACD) both tipping into overbought territory, though daily candlestick traders will want to wait for a slow-MA MACD crossover to confirm bearish momentum.
Technical Levels: Supports and Resistances
AUDNZD currently trading at 1.0917 at the time of writing. Pair opened at 1.0909 and is trading with a change of 0.07 % .
| Overview | Overview.1 | |
|---|---|---|
| 0 | Today last price | 1.0917 |
| 1 | Today Daily Change | 0.0008 |
| 2 | Today Daily Change % | 0.0700 |
| 3 | Today daily open | 1.0909 |
The pair remains strongly bullish on the daily timeframe. It trades above its 20 SMA @ 1.0761, 50 SMA 1.0805, 100 SMA @ 1.0826 and 200 SMA @ 1.082.
| Trends | Trends.1 | |
|---|---|---|
| 0 | Daily SMA20 | 1.0761 |
| 1 | Daily SMA50 | 1.0805 |
| 2 | Daily SMA100 | 1.0826 |
| 3 | Daily SMA200 | 1.0820 |
The previous day high was 1.093 while the previous day low was 1.09. The daily 38.2% Fib levels comes at 1.0918, expected to provide resistance. Similarly, the daily 61.8% fib level is at 1.0911, expected to provide support.
Note the levels of interest below:
- Pivot support is noted at 1.0896, 1.0882, 1.0865
- Pivot resistance is noted at 1.0926, 1.0943, 1.0957
| Levels | Levels.1 |
|---|---|
| Previous Daily High | 1.0930 |
| Previous Daily Low | 1.0900 |
| Previous Weekly High | 1.0915 |
| Previous Weekly Low | 1.0823 |
| Previous Monthly High | 1.0919 |
| Previous Monthly Low | 1.0718 |
| Daily Fibonacci 38.2% | 1.0918 |
| Daily Fibonacci 61.8% | 1.0911 |
| Daily Pivot Point S1 | 1.0896 |
| Daily Pivot Point S2 | 1.0882 |
| Daily Pivot Point S3 | 1.0865 |
| Daily Pivot Point R1 | 1.0926 |
| Daily Pivot Point R2 | 1.0943 |
| Daily Pivot Point R3 | 1.0957 |
[/s2If]
Download Nehcap EAWe have two EAs that are operational on our LIVE accounts.
- EA-FIX: Check out the details here. Download EA-FIX . EA-FIX is a non-grid HFT scalper.
- EA-GROWTH: High quality low dd EA using trend grids. Download EA_GROWTHJoin Our Telegram Group
")


