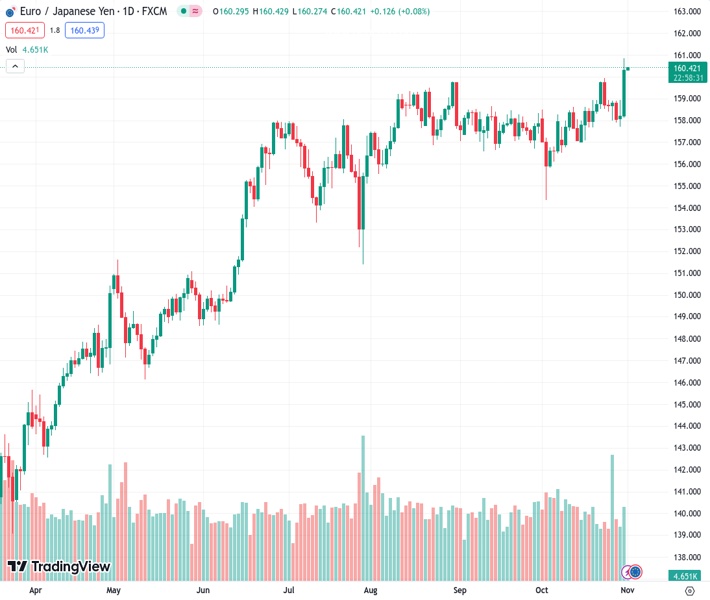
#EURJPY @ 160.379 reached a new YTD high of 160.85, closing Tuesday’s session with gains of over 1.32%.
…
This is a premium post.
[s2If !current_user_can(access_s2member_level4)]Please register for FREE REGISTER to read full post below containing analysis. In case of any error or you think you are not able to read the full post below, please email us at support#nehcap.com [lwa][/s2If] [s2If current_user_can(access_s2member_level1)]
- EUR/JPY reached a new YTD high of 160.85, closing Tuesday’s session with gains of over 1.32%.
The pair currently trades last at 160.379.
The previous day high was 158.93 while the previous day low was 157.7. The daily 38.2% Fib levels comes at 158.46, expected to provide support. Similarly, the daily 61.8% fib level is at 158.17, expected to provide support.
EUR/JPY rallies to a new year-to-date (YTD) high of 160.85, closing Tuesday’s session with gains of more than 1.32% or 200 pips post the Bank of Japan’s (BoJ) decision to keep its ultra-loose monetary policy. As Wednesday’s Asian session begins, the cross-currency pair trades at 160.35, almost unchanged.
With price action finally breaking the top of the range, the EUR/JPY uptrend remains intact, and it could be testing 13-year highs of 169.97, but buyers must face solid resistance levels ahead. The next resistance level would be the April 2008 high at 164.97 before rallying towards the 2008 highs.
Conversely, the EUR/JPY first support would be the 160.00 mark. Once cleared, the next support would be the Tenkan-Sen at 159.27, followed by the 159.00 mark. If sellers push prices lower, the next support would be the Senkou Span A at 158.43 before tripping towards 158.00.
Technical Levels: Supports and Resistances
EURJPY currently trading at 160.38 at the time of writing. Pair opened at 158.14 and is trading with a change of 1.42 % .
| Overview | Overview.1 | |
|---|---|---|
| 0 | Today last price | 160.38 |
| 1 | Today Daily Change | 2.24 |
| 2 | Today Daily Change % | 1.42 |
| 3 | Today daily open | 158.14 |
The pair remains strongly bullish on the daily timeframe. It trades above its 20 SMA @ 157.94, 50 SMA 157.92, 100 SMA @ 157.17 and 200 SMA @ 151.3.
| Trends | Trends.1 | |
|---|---|---|
| 0 | Daily SMA20 | 157.94 |
| 1 | Daily SMA50 | 157.92 |
| 2 | Daily SMA100 | 157.17 |
| 3 | Daily SMA200 | 151.30 |
The previous day high was 158.93 while the previous day low was 157.7. The daily 38.2% Fib levels comes at 158.46, expected to provide support. Similarly, the daily 61.8% fib level is at 158.17, expected to provide support.
Note the levels of interest below:
- Pivot support is noted at 157.58, 157.03, 156.36
- Pivot resistance is noted at 158.82, 159.49, 160.04
| Levels | Levels.1 |
|---|---|
| Previous Daily High | 158.93 |
| Previous Daily Low | 157.70 |
| Previous Weekly High | 159.92 |
| Previous Weekly Low | 157.88 |
| Previous Monthly High | 158.66 |
| Previous Monthly Low | 156.58 |
| Daily Fibonacci 38.2% | 158.46 |
| Daily Fibonacci 61.8% | 158.17 |
| Daily Pivot Point S1 | 157.58 |
| Daily Pivot Point S2 | 157.03 |
| Daily Pivot Point S3 | 156.36 |
| Daily Pivot Point R1 | 158.82 |
| Daily Pivot Point R2 | 159.49 |
| Daily Pivot Point R3 | 160.04 |
[/s2If]
Download Nehcap EAWe have two EAs that are operational on our LIVE accounts.
- EA-FIX: Check out the details here. Download EA-FIX . EA-FIX is a non-grid HFT scalper.
- EA-GROWTH: High quality low dd EA using trend grids. Download EA_GROWTHJoin Our Telegram Group
")


