#GBPUSD @ 1.21455 The Cable slightly retreated and closed Tuesday with 0.15% losses at 1.2150.
…
This is a premium post.
[s2If !current_user_can(access_s2member_level4)]Please register for FREE REGISTER to read full post below containing analysis. In case of any error or you think you are not able to read the full post below, please email us at support#nehcap.com [lwa][/s2If] [s2If current_user_can(access_s2member_level1)]
- The Cable slightly retreated and closed Tuesday with 0.15% losses at 1.2150.
The pair currently trades last at 1.21455.
The previous day high was 1.2175 while the previous day low was 1.209. The daily 38.2% Fib levels comes at 1.2143, expected to provide support. Similarly, the daily 61.8% fib level is at 1.2123, expected to provide support.
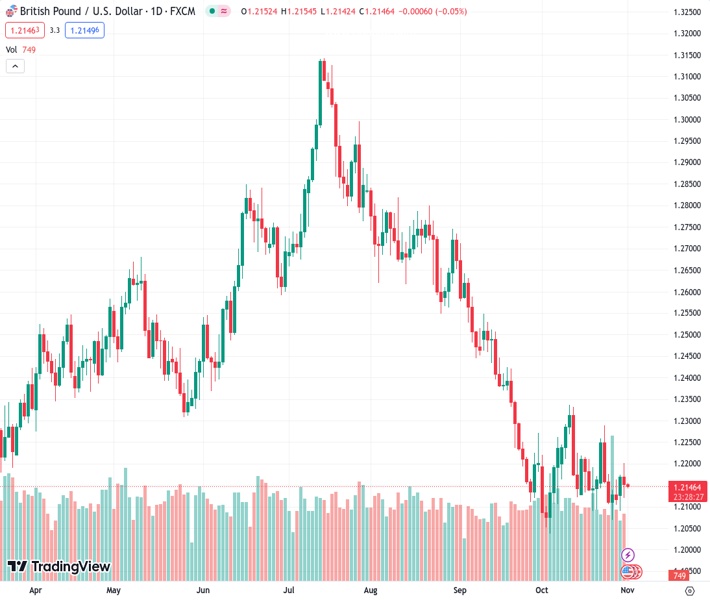
In Tuesday’s session, the GBP/USD traded in the 1.2120 – 1.2200 range, closing with mild losses around 1.2150. On the USD side, it gained momentum with the DXY Index, advancing to 106.70, mainly driven by a cautious market mood. In that sense, as the economic calendar was empty with no relevant reports released by the US or the UK, the Greenback’s strength explained the pair’s trajectory.
On the Federal Reserve’s (Fed) side, investors await more clues on the bank’s stance, specifically on how they are assessing the recent robust economic reports and how they would impact their policy stance as they may give the officials reasoning to continue hiking. That being said, since the September meeting, inflation and job creation have decelerated, which would favour the case of the Fed finishing its tightening cycle with no hikes in the remainder of 2023. Markets have already discounted a pause for Wednesday’s announcement, and the odds of a hike in December are still low but the bank’s stance will likely impact the expectations for the last meeting of 2023.
On the Bank of England’s side, investors aren’t foreseeing a hike and will also look for clues for placing their bets for the next meetings on the bank’s statement and on Andrew Bailey’s words. Regarding the forecasts, there are growing expectations that as recent economic activity data came in weak, the bank will revise to the downside growth estimations while inflation projections are expected to be revised to the upside as prices remain stubbornly high.
Analysing the daily chart, GBP/USD presents a bearish outlook for the short term. Both the Relative Strength Index (RSI) and Moving Average Convergence Divergence (MACD) remain in negative territory, and the pair is below the 20,100 and 200-day Simple Moving Averages (SMAs), which highlights the continued dominance of bears on the broader scale.
Support levels: 1.2100, 1.2080, 1.2050.
Resistance levels: 1.2180 (20-day SMA), 1.2200, 1.2250.
Technical Levels: Supports and Resistances
GBPUSD currently trading at 1.2148 at the time of writing. Pair opened at 1.2168 and is trading with a change of -0.16 % .
| Overview | Overview.1 | |
|---|---|---|
| 0 | Today last price | 1.2148 |
| 1 | Today Daily Change | -0.0020 |
| 2 | Today Daily Change % | -0.1600 |
| 3 | Today daily open | 1.2168 |
The pair remains strongly bearish on the daily time frame. It trades below the 20 SMA @ 1.2179, 50 SMA 1.234, 100 SMA @ 1.2567 and 200 SMA @ 1.2438.
| Trends | Trends.1 | |
|---|---|---|
| 0 | Daily SMA20 | 1.2179 |
| 1 | Daily SMA50 | 1.2340 |
| 2 | Daily SMA100 | 1.2567 |
| 3 | Daily SMA200 | 1.2438 |
The previous day high was 1.2175 while the previous day low was 1.209. The daily 38.2% Fib levels comes at 1.2143, expected to provide support. Similarly, the daily 61.8% fib level is at 1.2123, expected to provide support.
Note the levels of interest below:
- Pivot support is noted at 1.2114, 1.206, 1.2029
- Pivot resistance is noted at 1.2198, 1.2229, 1.2283
| Levels | Levels.1 |
|---|---|
| Previous Daily High | 1.2175 |
| Previous Daily Low | 1.2090 |
| Previous Weekly High | 1.2289 |
| Previous Weekly Low | 1.2070 |
| Previous Monthly High | 1.2713 |
| Previous Monthly Low | 1.2111 |
| Daily Fibonacci 38.2% | 1.2143 |
| Daily Fibonacci 61.8% | 1.2123 |
| Daily Pivot Point S1 | 1.2114 |
| Daily Pivot Point S2 | 1.2060 |
| Daily Pivot Point S3 | 1.2029 |
| Daily Pivot Point R1 | 1.2198 |
| Daily Pivot Point R2 | 1.2229 |
| Daily Pivot Point R3 | 1.2283 |
[/s2If]
Download Nehcap EAWe have two EAs that are operational on our LIVE accounts.
- EA-FIX: Check out the details here. Download EA-FIX . EA-FIX is a non-grid HFT scalper.
- EA-GROWTH: High quality low dd EA using trend grids. Download EA_GROWTHJoin Our Telegram Group
")


