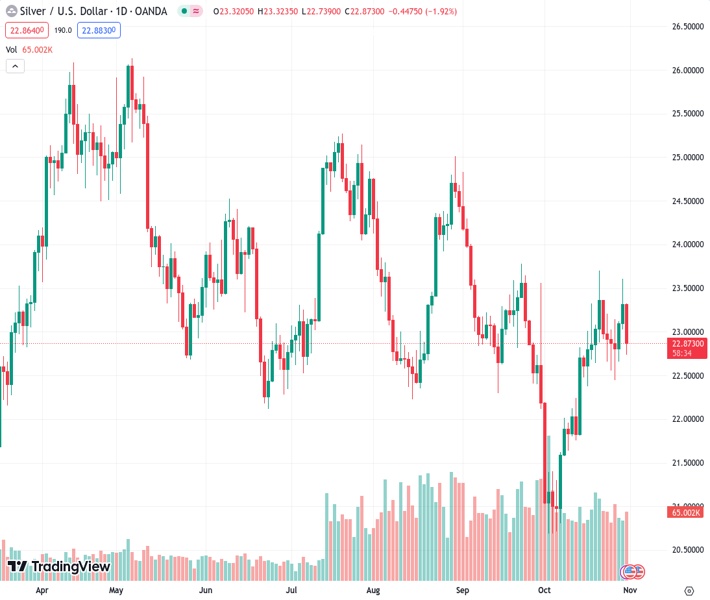
#XAGUSD @ 22.879 Silver is facing a potential double-top formation on the daily chart suggests further retracement is possible.
…
This is a premium post.
[s2If !current_user_can(access_s2member_level4)]Please register for FREE REGISTER to read full post below containing analysis. In case of any error or you think you are not able to read the full post below, please email us at support#nehcap.com [lwa][/s2If] [s2If current_user_can(access_s2member_level1)]
- Silver is facing a potential double-top formation on the daily chart suggests further retracement is possible.
The pair currently trades last at 22.879.
The previous day high was 23.61 while the previous day low was 23.02. The daily 38.2% Fib levels comes at 23.38, expected to provide resistance. Similarly, the daily 61.8% fib level is at 23.24, expected to provide resistance.
Silver price trips down and aims below the $23.00 mark, which was briefly visited by the grey metal and capped by a strong recovery from the Greenback. The XAG/USD is trading at $22.86, down 1.82%.
A double-top in the daily chart is forming, suggesting that XAG/USD could retrace further, past the latest cycle low of $22.45, the October 26 low. However, on its way to challenging the latter, Silver must break key technical support levels like the 50-day moving average (DMA) at 422.93, and the 20-day moving average (DMA) at $22.45. Once those levels are cleared, Silver could shift from a neutral to a downward bias.
Conversely, if XAG/USD stays above the 50-DMA and reclaims $23.00, the following resistance level would be the 200-DMA at $23.28, which needs to be cleared, along with the September 23 daily high at $23.77, the latest cycle high, to shift the grey-metal bias to upwards. In that outcome, the XAG/USD next resistance would be $24.00.
Technical Levels: Supports and Resistances
XAGUSD currently trading at 22.87 at the time of writing. Pair opened at 23.32 and is trading with a change of -1.93 % .
| Overview | Overview.1 | |
|---|---|---|
| 0 | Today last price | 22.87 |
| 1 | Today Daily Change | -0.45 |
| 2 | Today Daily Change % | -1.93 |
| 3 | Today daily open | 23.32 |
The pair is trading above its 20 Daily moving average @ 22.39, below its 50 Daily moving average @ 22.97 , below its 100 Daily moving average @ 23.24 and below its 200 Daily moving average @ 23.3
| Trends | Trends.1 | |
|---|---|---|
| 0 | Daily SMA20 | 22.39 |
| 1 | Daily SMA50 | 22.97 |
| 2 | Daily SMA100 | 23.24 |
| 3 | Daily SMA200 | 23.30 |
The previous day high was 23.61 while the previous day low was 23.02. The daily 38.2% Fib levels comes at 23.38, expected to provide resistance. Similarly, the daily 61.8% fib level is at 23.24, expected to provide resistance.
Note the levels of interest below:
- Pivot support is noted at 23.03, 22.73, 22.44
- Pivot resistance is noted at 23.61, 23.91, 24.2
| Levels | Levels.1 |
|---|---|
| Previous Daily High | 23.61 |
| Previous Daily Low | 23.02 |
| Previous Weekly High | 23.36 |
| Previous Weekly Low | 22.44 |
| Previous Monthly High | 24.82 |
| Previous Monthly Low | 22.12 |
| Daily Fibonacci 38.2% | 23.38 |
| Daily Fibonacci 61.8% | 23.24 |
| Daily Pivot Point S1 | 23.03 |
| Daily Pivot Point S2 | 22.73 |
| Daily Pivot Point S3 | 22.44 |
| Daily Pivot Point R1 | 23.61 |
| Daily Pivot Point R2 | 23.91 |
| Daily Pivot Point R3 | 24.20 |
[/s2If]
Download Nehcap EAWe have two EAs that are operational on our LIVE accounts.
- EA-FIX: Check out the details here. Download EA-FIX . EA-FIX is a non-grid HFT scalper.
- EA-GROWTH: High quality low dd EA using trend grids. Download EA_GROWTHJoin Our Telegram Group
")


