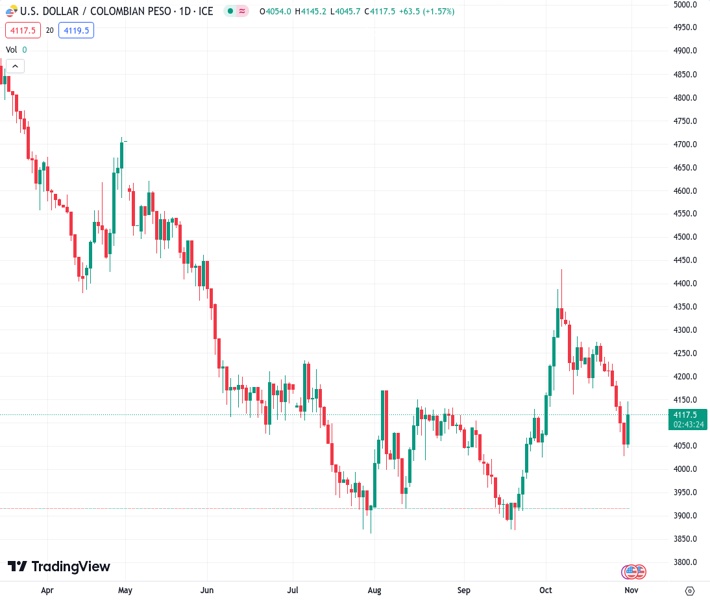
#USDCOP @ 4,117.50 is up by more than 1.50%, towards 4122.5.
…
This is a premium post.
[s2If !current_user_can(access_s2member_level4)]Please register for FREE REGISTER to read full post below containing analysis. In case of any error or you think you are not able to read the full post below, please email us at support#nehcap.com [lwa][/s2If] [s2If current_user_can(access_s2member_level1)]
- USD/COP is up by more than 1.50%, towards 4122.5.
The pair currently trades last at 4117.50.
The previous day high was 4129.5903 while the previous day low was 4034.65. The daily 38.2% Fib levels comes at 4070.9172, expected to provide support. Similarly, the daily 61.8% fib level is at 4093.3231, expected to provide support.
The USD/COP sharply rose on Tuesday, mainly driven by a cautious market mood ahead of the Federal Reserve (Fed) and the Colombian central bank decisions on Wednesday and Thursday.
On the US side, markets have already discounted a pause, but investors are looking for further clues on the Fed’s plan for the December meeting to take on their next positions. As for now, the CME FedWatch tool suggests that the odds of a hike in the last meeting of 2023 are low, but the policy statement and Chair Powell’s presser will likely impact those expectations.
Recent indicators reported that the US economy is doing better than expected, which will probably give the Fed officials reasons to leave the door open to hiking agains. Job creation has slightly decelerated, but the economic activity remains strong, which gave the Greenback traction in the last sessions.
On the COP’s side, markets are also discounting a pause in Thursday’s quarterly report from the Colombian Central Bank, holding rates at 13.25%. In the last meeting, the bank sounded hawkish and considered that its wasn’t prudent to consider cutting rates due to the recent economic data. In the meantime, swaps markets are discounting higher odds of the easing cycle to start next December.
According to the daily chart, the technical outlook for the USD/COP remains neutral to bearish, as despite the bulls gaining ground, the bears are in command. The Relative Strength Index (RSI) shows an upward trend below its midline, suggesting a potential resurgence of bullish strength, while the Moving Average Convergence (MACD) prints neutral red bars.
In the larger context, the pair is below the 20 and 200-day Simple Moving Averages (SMAs), and if the bulls hold above the 100-day average, the buyers may have some hope of stopping the recent bearish momentum.
Support levels: 4096.7 (100-day SMA), 4045.7,4027.3.
Resistance levels: 4147.8,4175.5, 4190.9.
Technical Levels: Supports and Resistances
USDCOP currently trading at 4118.0 at the time of writing. Pair opened at 4066.0 and is trading with a change of 1.28 % .
| Overview | Overview.1 | |
|---|---|---|
| 0 | Today last price | 4118.00 |
| 1 | Today Daily Change | 52.00 |
| 2 | Today Daily Change % | 1.28 |
| 3 | Today daily open | 4066.00 |
The pair is trading below its 20 Daily moving average @ 4228.118, above its 50 Daily moving average @ 4113.175 , above its 100 Daily moving average @ 4098.3142 and below its 200 Daily moving average @ 4358.7137
| Trends | Trends.1 | |
|---|---|---|
| 0 | Daily SMA20 | 4228.1180 |
| 1 | Daily SMA50 | 4113.1750 |
| 2 | Daily SMA100 | 4098.3142 |
| 3 | Daily SMA200 | 4358.7137 |
The previous day high was 4129.5903 while the previous day low was 4034.65. The daily 38.2% Fib levels comes at 4070.9172, expected to provide support. Similarly, the daily 61.8% fib level is at 4093.3231, expected to provide support.
Note the levels of interest below:
- Pivot support is noted at 4023.9032, 3981.8065, 3928.9629
- Pivot resistance is noted at 4118.8435, 4171.6871, 4213.7838
| Levels | Levels.1 |
|---|---|
| Previous Daily High | 4129.5903 |
| Previous Daily Low | 4034.6500 |
| Previous Weekly High | 4260.2669 |
| Previous Weekly Low | 4092.3500 |
| Previous Monthly High | 4129.6400 |
| Previous Monthly Low | 3868.0000 |
| Daily Fibonacci 38.2% | 4070.9172 |
| Daily Fibonacci 61.8% | 4093.3231 |
| Daily Pivot Point S1 | 4023.9032 |
| Daily Pivot Point S2 | 3981.8065 |
| Daily Pivot Point S3 | 3928.9629 |
| Daily Pivot Point R1 | 4118.8435 |
| Daily Pivot Point R2 | 4171.6871 |
| Daily Pivot Point R3 | 4213.7838 |
[/s2If]
Download Nehcap EAWe have two EAs that are operational on our LIVE accounts.
- EA-FIX: Check out the details here. Download EA-FIX . EA-FIX is a non-grid HFT scalper.
- EA-GROWTH: High quality low dd EA using trend grids. Download EA_GROWTHJoin Our Telegram Group
")


