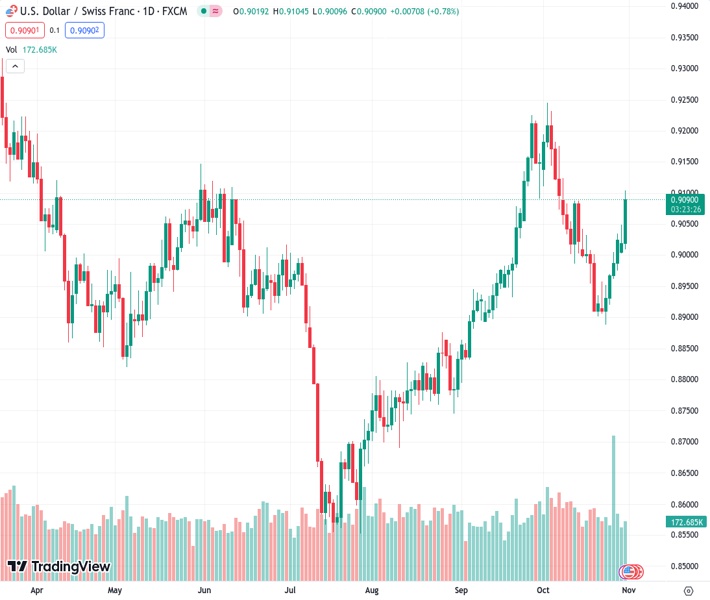
#USDCHF @ 0.90895 tallies a sixth consecutive day of gains, rising to a high above 0.9100 and then settled at 0.9080.
…
This is a premium post.
[s2If !current_user_can(access_s2member_level4)]Please register for FREE REGISTER to read full post below containing analysis. In case of any error or you think you are not able to read the full post below, please email us at support#nehcap.com [lwa][/s2If] [s2If current_user_can(access_s2member_level1)]
- USD/CHF tallies a sixth consecutive day of gains, rising to a high above 0.9100 and then settled at 0.9080.
The pair currently trades last at 0.90895.
The previous day high was 0.9049 while the previous day low was 0.9008. The daily 38.2% Fib levels comes at 0.9023, expected to provide support. Similarly, the daily 61.8% fib level is at 0.9033, expected to provide support.
On Tuesday, the USD/CHF extended its gains and rose to its highest level since mid-month, above 0.9100 and now trades above its primary 20,100 and 200-day Simple Moving Averages (SMAs). Daily market movers for the pair included mid-tier housing, consumer confidence and economic activity figures from the US but the Greenback is strengthening ahead of the Federal Reserve (Fed) decision on Wednesday.
On the data front, the House Price Index from August came in at 0.6% MoM, beating the expected 0.5% but declining from its previous reading of 0.8%. Furthermore, the S&P/Case-Shiller Home Price from August came in at 2.2% YoY, higher than the expected 1.6% and accelerated regarding its last reading of 0.2%. In addition, the CB Consumer Confidence Index from October also beat expectations, coming in at 102.6.
On the negative side, the Institute for Supply Management – Chicago reported that the Chicago PMI from October came in lower than expected at 44 vs the expected 45 and declined from its previous reading of 44.1.
Regarding the Fed’s decision, a pause is priced in, and investors will closely look at the policy statement and Chair Powell’s tone in his presser following the decision. In the last meeting, the bank hinted at a “cautious” stance, pointing out that the decisions will be decided carefully, and Powell left the door open for further tightening if the incoming data justifies it. In line with that, investors seem to be refraining from taking on big positions and instead seeking refuge in the USD, which is pushing the pair to the upside and lowering the demand for riskier assets.
The technical analysis of USD/CHF highlights a short-term bullish trend. Nevertheless, traders should be mindful of overbought conditions, as these signals may foreshadow an incoming technical correction. The Relative Strength Index (RSI) displays a strong upward momentum in the overbought region, while the Moving Average Convergence (MACD) histogram presents larger green bars. Additionally, the pair is above the 20,100,200-day Simple Moving Average (SMA), indicating that the buyers command the broader perspective.
Resistance levels: 0.9090, 0.9100, 0.9150.
Support levels: 0.9050, 0.9015-0.9000 (20 and 200-day SMA convergence), 0.8970.
Technical Levels: Supports and Resistances
USDCHF currently trading at 0.9084 at the time of writing. Pair opened at 0.902 and is trading with a change of 0.71 % .
| Overview | Overview.1 | |
|---|---|---|
| 0 | Today last price | 0.9084 |
| 1 | Today Daily Change | 0.0064 |
| 2 | Today Daily Change % | 0.7100 |
| 3 | Today daily open | 0.9020 |
The pair remains strongly bullish on the daily timeframe. It trades above its 20 SMA @ 0.9026, 50 SMA 0.8982, 100 SMA @ 0.8896 and 200 SMA @ 0.9007.
| Trends | Trends.1 | |
|---|---|---|
| 0 | Daily SMA20 | 0.9026 |
| 1 | Daily SMA50 | 0.8982 |
| 2 | Daily SMA100 | 0.8896 |
| 3 | Daily SMA200 | 0.9007 |
The previous day high was 0.9049 while the previous day low was 0.9008. The daily 38.2% Fib levels comes at 0.9023, expected to provide support. Similarly, the daily 61.8% fib level is at 0.9033, expected to provide support.
Note the levels of interest below:
- Pivot support is noted at 0.9002, 0.8984, 0.8961
- Pivot resistance is noted at 0.9044, 0.9067, 0.9085
| Levels | Levels.1 |
|---|---|
| Previous Daily High | 0.9049 |
| Previous Daily Low | 0.9008 |
| Previous Weekly High | 0.9035 |
| Previous Weekly Low | 0.8888 |
| Previous Monthly High | 0.9225 |
| Previous Monthly Low | 0.8795 |
| Daily Fibonacci 38.2% | 0.9023 |
| Daily Fibonacci 61.8% | 0.9033 |
| Daily Pivot Point S1 | 0.9002 |
| Daily Pivot Point S2 | 0.8984 |
| Daily Pivot Point S3 | 0.8961 |
| Daily Pivot Point R1 | 0.9044 |
| Daily Pivot Point R2 | 0.9067 |
| Daily Pivot Point R3 | 0.9085 |
[/s2If]
Download Nehcap EAWe have two EAs that are operational on our LIVE accounts.
- EA-FIX: Check out the details here. Download EA-FIX . EA-FIX is a non-grid HFT scalper.
- EA-GROWTH: High quality low dd EA using trend grids. Download EA_GROWTHJoin Our Telegram Group
")


