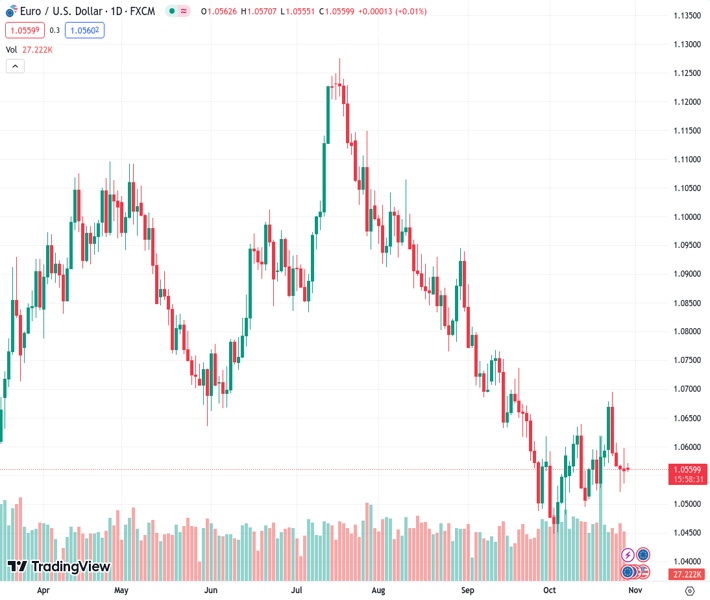
#EURUSD @ 1.05610 lacks any firm intraday direction and oscillates in a narrow range on Monday.
…
This is a premium post.
[s2If !current_user_can(access_s2member_level4)]Please register for FREE REGISTER to read full post below containing analysis. In case of any error or you think you are not able to read the full post below, please email us at support#nehcap.com [lwa][/s2If] [s2If current_user_can(access_s2member_level1)]
- EUR/USD lacks any firm intraday direction and oscillates in a narrow range on Monday.
The pair currently trades last at 1.05610.
The previous day high was 1.0597 while the previous day low was 1.0536. The daily 38.2% Fib levels comes at 1.0574, expected to provide resistance. Similarly, the daily 61.8% fib level is at 1.0559, expected to provide support.
The EUR/USD pair struggles to gain any meaningful traction on Monday and remains confined in a narrow trading band, just above mid-1.0500s through the Asian session.
The US economic resilience keeps the door open for one more rate hike by the Federal Reserve (Fed) and remains supportive of elevated US Treasury bond yields. This, in turn, is seen acting as a tailwind for the US Dollar (USD), which, along with the European Central Bank’s (ECB) dovish outlook, continues to cap the upside for the EUR/USD pair.
From a technical perspective, the recent recovery from the 1.0445-1.0450 region, or the YTD low, has been along an upward-sloping channel. Against the backdrop of a sharp fall from a 17-month peak touched in June, this constitutes the formation of a bearish flag pattern and suggests that the path of least resistance for the EUR/USD pair is to the downside.
Moreover, negative oscillators on the daily chart add credence to the bearish outlook. That said, it will still be prudent to wait for a convincing break below the ascending channel support, around the 1.0540-1.0535 region, before positioning for a slide towards the 1.0500 mark. The EUR/USD pair could eventually drop to restest the 1.0450-1.0445 area or the YTD trough.
On the flip side, Friday’s swing high, nearing the 1.0600 mark, now seems to act as an immediate hurdle. A sustained strength beyond has the potential to lift the EUR/USD pair towards the 1.0665-1.0670 intermediate resistance en route to the top end of the aforementioned trend channel, currently pegged just ahead of the 1.0700 round-figure mark.
The latter should act as a key pivotal point for short-term traders, which if cleared decisively will negate the bearish flag pattern and prompt aggressive short-covering move. The EUR/USD pair then aim to surpass the 1.0800 mark and challenge the 1.0810-1.0815 confluence, comprising the 100-day and the 200-day Simple Moving Averages (SMAs).
Technical Levels: Supports and Resistances
EURUSD currently trading at 1.056 at the time of writing. Pair opened at 1.0564 and is trading with a change of -0.04 % .
| Overview | Overview.1 | |
|---|---|---|
| 0 | Today last price | 1.0560 |
| 1 | Today Daily Change | -0.0004 |
| 2 | Today Daily Change % | -0.0400 |
| 3 | Today daily open | 1.0564 |
The pair remains strongly bearish on the daily time frame. It trades below the 20 SMA @ 1.0561, 50 SMA 1.066, 100 SMA @ 1.0819 and 200 SMA @ 1.0814.
| Trends | Trends.1 | |
|---|---|---|
| 0 | Daily SMA20 | 1.0561 |
| 1 | Daily SMA50 | 1.0660 |
| 2 | Daily SMA100 | 1.0819 |
| 3 | Daily SMA200 | 1.0814 |
The previous day high was 1.0597 while the previous day low was 1.0536. The daily 38.2% Fib levels comes at 1.0574, expected to provide resistance. Similarly, the daily 61.8% fib level is at 1.0559, expected to provide support.
Note the levels of interest below:
- Pivot support is noted at 1.0534, 1.0504, 1.0473
- Pivot resistance is noted at 1.0596, 1.0627, 1.0658
| Levels | Levels.1 |
|---|---|
| Previous Daily High | 1.0597 |
| Previous Daily Low | 1.0536 |
| Previous Weekly High | 1.0695 |
| Previous Weekly Low | 1.0522 |
| Previous Monthly High | 1.0882 |
| Previous Monthly Low | 1.0488 |
| Daily Fibonacci 38.2% | 1.0574 |
| Daily Fibonacci 61.8% | 1.0559 |
| Daily Pivot Point S1 | 1.0534 |
| Daily Pivot Point S2 | 1.0504 |
| Daily Pivot Point S3 | 1.0473 |
| Daily Pivot Point R1 | 1.0596 |
| Daily Pivot Point R2 | 1.0627 |
| Daily Pivot Point R3 | 1.0658 |
[/s2If]
Download Nehcap EAWe have two EAs that are operational on our LIVE accounts.
- EA-FIX: Check out the details here. Download EA-FIX . EA-FIX is a non-grid HFT scalper.
- EA-GROWTH: High quality low dd EA using trend grids. Download EA_GROWTHJoin Our Telegram Group


