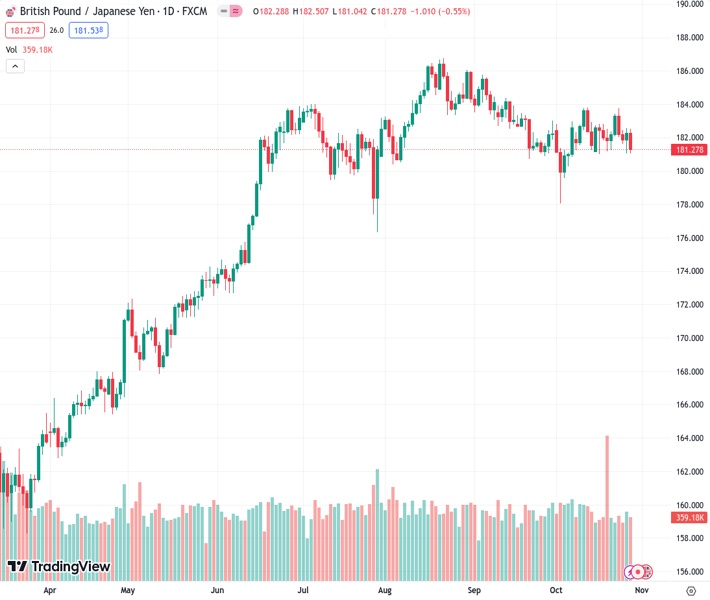
#GBPJPY @ 181.295 The slipped back towards the 181.00 handle heading into the Friday close.
…
This is a premium post.
[s2If !current_user_can(access_s2member_level4)]Please register for FREE REGISTER to read full post below containing analysis. In case of any error or you think you are not able to read the full post below, please email us at support#nehcap.com [lwa][/s2If] [s2If current_user_can(access_s2member_level1)]
- The GBP/JPY slipped back towards the 181.00 handle heading into the Friday close.
The pair currently trades last at 181.295.
The previous day high was 182.59 while the previous day low was 181.14. The daily 38.2% Fib levels comes at 182.03, expected to provide resistance. Similarly, the daily 61.8% fib level is at 181.69, expected to provide resistance.
The GBP/JPY twisted back into familiar low side territory for the week, capping off Friday’s trading just north of the 181.00 handle. The Guppy hit a fresh low for the week at 181.04 before catching a bounceback into 181.40 at the closing bell.
The pair is now set to drift into next week’s central bank action, with both the Bank of Japan (BoJ) and the Bank of England (BoE) on the cards.
Tuesday sees the BoJ give their latest rate call, and investors are looking for adjustments in the Japanese central bank’s policy regime. Japanese inflation continues to stick higher than BoJ policymakers initially expected, with the BoJ bluntly concerned about inflation flagging below their 2% minimum target.
Months of inflation running hotter has left Japanese consumers begging for action from the BoJ to defend their rapidly dwindling purchasing power at the hands of a crumbling Yen that has done little but decline as global interest rate differentials eat away at the JPY.
Despite a 3% pullback from 2023’s highs near 168.80, the Yen remains down almost 17% against the Pound Sterling and the GBP/JPY pair up over 2,600 pips from the year’s lows near 155.00 set back in January.
On the GBP side, the BoE is on the docket for Thursday with their latest rate call, but money markets have priced in a nearly guaranteed rate hold as the UK economy continues to flounder.
This week’s employment and Purchasing Managers’ Index figures published just this last Tuesday did little to bolster confidence in the UK economy, with an unexpected increase in the number of unemployment benefits seekers and mixed PMIs suggesting lagging growth which continues to chug.
The GBP/JPY spent most of the week trading towards the downside as the Yen looks to firm up after a disastrous 2023. The Guppy hits the closing bell down 1.3% from the week’s early Tuesday high of 183.75 near 181.40.
The 200-hour Simple Moving Average (SMA) continues to vex the GPB/JPY as the pair trades laterally against the near-term trend, and continued challenges to the downside could open the way for further declines heading into next week’s central bank double showing.
Despite extreme overbought chart conditions, intraday traders might want to wait for a bullish reversal signal on the hourly candle Moving Average Convergence-Divergence (MACD) oscillator, while daily candlesticks see the Relative Strength Index (RSI) firmly planted in the midrange, pointing donwards.
Technical Levels: Supports and Resistances
GBPJPY currently trading at 181.39 at the time of writing. Pair opened at 182.42 and is trading with a change of -0.56 % .
| Overview | Overview.1 | |
|---|---|---|
| 0 | Today last price | 181.39 |
| 1 | Today Daily Change | -1.03 |
| 2 | Today Daily Change % | -0.56 |
| 3 | Today daily open | 182.42 |
The pair is trading below its 20 Daily moving average @ 182.08, below its 50 Daily moving average @ 183.09 , below its 100 Daily moving average @ 182.43 and above its 200 Daily moving average @ 173.92
| Trends | Trends.1 | |
|---|---|---|
| 0 | Daily SMA20 | 182.08 |
| 1 | Daily SMA50 | 183.09 |
| 2 | Daily SMA100 | 182.43 |
| 3 | Daily SMA200 | 173.92 |
The previous day high was 182.59 while the previous day low was 181.14. The daily 38.2% Fib levels comes at 182.03, expected to provide resistance. Similarly, the daily 61.8% fib level is at 181.69, expected to provide resistance.
Note the levels of interest below:
- Pivot support is noted at 181.51, 180.6, 180.05
- Pivot resistance is noted at 182.96, 183.5, 184.41
| Levels | Levels.1 |
|---|---|
| Previous Daily High | 182.59 |
| Previous Daily Low | 181.14 |
| Previous Weekly High | 182.81 |
| Previous Weekly Low | 181.02 |
| Previous Monthly High | 185.78 |
| Previous Monthly Low | 180.82 |
| Daily Fibonacci 38.2% | 182.03 |
| Daily Fibonacci 61.8% | 181.69 |
| Daily Pivot Point S1 | 181.51 |
| Daily Pivot Point S2 | 180.60 |
| Daily Pivot Point S3 | 180.05 |
| Daily Pivot Point R1 | 182.96 |
| Daily Pivot Point R2 | 183.50 |
| Daily Pivot Point R3 | 184.41 |
[/s2If]
Download Nehcap EAWe have two EAs that are operational on our LIVE accounts.
- EA-FIX: Check out the details here. Download EA-FIX . EA-FIX is a non-grid HFT scalper.
- EA-GROWTH: High quality low dd EA using trend grids. Download EA_GROWTHJoin Our Telegram Group
")


