#GBPUSD @ 1.21639 The flubbed a one-week high after UK PMIs missed expectations.
…
This is a premium post.
[s2If !current_user_can(access_s2member_level4)]Please register for FREE REGISTER to read full post below containing analysis. In case of any error or you think you are not able to read the full post below, please email us at support#nehcap.com [lwa][/s2If] [s2If current_user_can(access_s2member_level1)]
- The GBP/USD flubbed a one-week high after UK PMIs missed expectations.
The pair currently trades last at 1.21639.
The previous day high was 1.2259 while the previous day low was 1.2144. The daily 38.2% Fib levels comes at 1.2215, expected to provide resistance. Similarly, the daily 61.8% fib level is at 1.2188, expected to provide resistance.
The GBP/USD is shedding pips on Tuesday, declining from a one-week high just shy of the 1.2300 handle after UK Purchasing Managers’ Index (PMI) figures printed red while US PMI data broadly beat the Street, climbing over market forecasts and chalking in accelerating economic activity in the US economy.
With the US economy continuing to gain ground while the rest of the global economy stagnates or begins to show cracks, market sentiment is prone to downside risk-off shocks as steadily-improving economic indicators for the US decrease chances of the Federal Reserve (Fed) picking up the pace of rate cuts moving forward.
Markets are currently hoping for Fed rate cuts to begin sometime in the back half of 2024, but a lack of weakness in the US economy bodes poorly for interest rate decrease hopes. Investors flocked to the safe-haven US Dollar on reaction to US PMI figures coming in green across the board.
UK Preliminary Services PMI inches lower to 49.2 in October vs. 49.5 expected
The seasonally-adjusted S&P Global/CIPS UK Manufacturing Purchasing Managers’ Index (PMI) gave a slight uptick to 45.2 in October, just barely beating the anticipated value of 45.0 and climbing over September’s final reading of 44.3.
At the same time, the Preliminary UK Services Business Activity Index declined to a nine-month low, printing at 49.2 for October, as compared to the final print of 49.3 in September and falling short of the expected figure of 49.5.
US S&P Global Manufacturing PMI edges higher to 50 in October, Services PMI improves to 50.9
In early October, economic activity within the US private sector showed a steady yet moderate expansion. The S&P Global Composite PMI advanced from 50.2 in September to 51.
October also saw the Manufacturing PMI climb from 49.8 to 50, while the Services PMI stepped higher, to 50.9 from 50.1. Both components of the US PMI forward-looking indicator beat expectations set by industry analysts.
With another batch of Greenback-bullish data in the books, GBP/USD traders will be looking ahead to a speech from Fed Chairman Jerome Powell on Wednesday, who will be giving opening remarks at the Moynihan Lecture in Social Science and Public Policy in Washington, DC.
Thursday will also see an advance reading of US Gross Domestic Product (GDP) figures, alongside US Unemployment Claims.
The Preliminary GDP for the US’ third quarter of 2023 is expected to increase appreciably from 2.1% to 4.3%, while Initial Jobless Claims for the week into October 20th is expected to print a slight increase of new jobless benefits seekers, from 198K to 208K, a net increase of 10K.
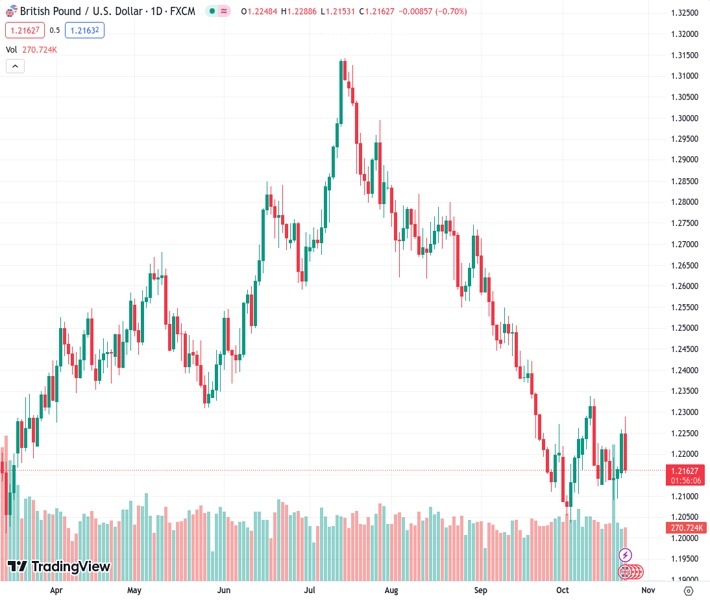
Tuesday’s backslide sees the GBP/USD facing a rejection from a bearish trendline from July’s peaks near 1.3141 after the pair failed to recapture the 1.2300 handle, and the immediate downside sees a price floor from the last major swing low into 1.2037 in early October.
Topside momentum will face stiff resistance from the downside trendline, as well as the last swing high into 1.2337, and the Sterling-Dollar pair is set for near-term consolidation if market risk appetite recovers, or an extension of bearish declines if US data continues to snub investor hopes for rate-cut inspiring weakness.
Technical Levels: Supports and Resistances
GBPUSD currently trading at 1.2158 at the time of writing. Pair opened at 1.2249 and is trading with a change of -0.74 % .
| Overview | Overview.1 | |
|---|---|---|
| 0 | Today last price | 1.2158 |
| 1 | Today Daily Change | -0.0091 |
| 2 | Today Daily Change % | -0.7400 |
| 3 | Today daily open | 1.2249 |
The pair remains strongly bearish on the daily time frame. It trades below the 20 SMA @ 1.2184, 50 SMA 1.24, 100 SMA @ 1.2585 and 200 SMA @ 1.2444.
| Trends | Trends.1 | |
|---|---|---|
| 0 | Daily SMA20 | 1.2184 |
| 1 | Daily SMA50 | 1.2400 |
| 2 | Daily SMA100 | 1.2585 |
| 3 | Daily SMA200 | 1.2444 |
The previous day high was 1.2259 while the previous day low was 1.2144. The daily 38.2% Fib levels comes at 1.2215, expected to provide resistance. Similarly, the daily 61.8% fib level is at 1.2188, expected to provide resistance.
Note the levels of interest below:
- Pivot support is noted at 1.2175, 1.2102, 1.206
- Pivot resistance is noted at 1.2291, 1.2332, 1.2406
| Levels | Levels.1 |
|---|---|
| Previous Daily High | 1.2259 |
| Previous Daily Low | 1.2144 |
| Previous Weekly High | 1.2220 |
| Previous Weekly Low | 1.2090 |
| Previous Monthly High | 1.2713 |
| Previous Monthly Low | 1.2111 |
| Daily Fibonacci 38.2% | 1.2215 |
| Daily Fibonacci 61.8% | 1.2188 |
| Daily Pivot Point S1 | 1.2175 |
| Daily Pivot Point S2 | 1.2102 |
| Daily Pivot Point S3 | 1.2060 |
| Daily Pivot Point R1 | 1.2291 |
| Daily Pivot Point R2 | 1.2332 |
| Daily Pivot Point R3 | 1.2406 |
[/s2If]
Download Nehcap EAWe have two EAs that are operational on our LIVE accounts.
- EA-FIX: Check out the details here. Download EA-FIX . EA-FIX is a non-grid HFT scalper.
- EA-GROWTH: High quality low dd EA using trend grids. Download EA_GROWTHJoin Our Telegram Group
")


