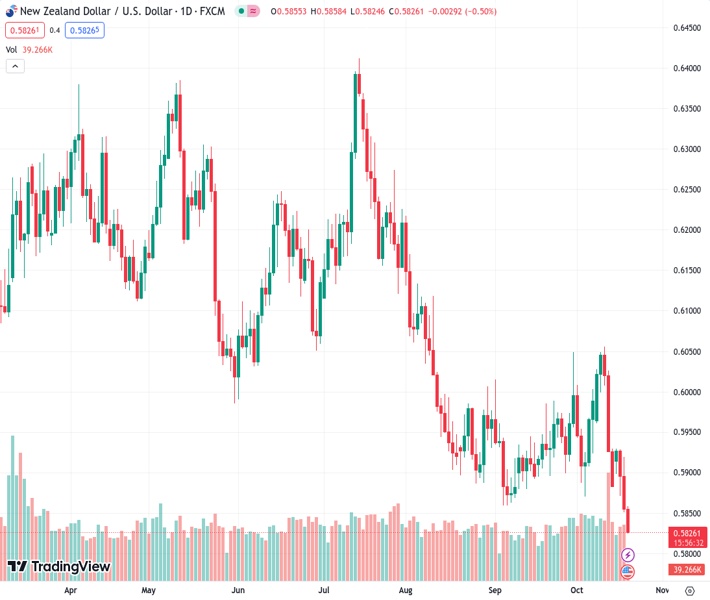
#NZDUSD @ 0.58261 drifts lower for the third straight day and touched its lowest level since November 2022.
…
This is a premium post.
[s2If !current_user_can(access_s2member_level4)]Please register for FREE REGISTER to read full post below containing analysis. In case of any error or you think you are not able to read the full post below, please email us at support#nehcap.com [lwa][/s2If] [s2If current_user_can(access_s2member_level1)]
- NZD/USD drifts lower for the third straight day and touched its lowest level since November 2022.
The pair currently trades last at 0.58261.
The previous day high was 0.5921 while the previous day low was 0.5851. The daily 38.2% Fib levels comes at 0.5878, expected to provide resistance. Similarly, the daily 61.8% fib level is at 0.5894, expected to provide resistance.
The NZD/USD pair remains under heavy selling pressure for the third successive day – also marking the sixth day of a negative move in the previous seven – and dives to its lowest level since early November 2022 during the Asian session on Thursday. Spot prices currently trade around the 0.5825 region, down over 0.40% for the day, and seem vulnerable to prolonging the recent declining trend from the 0.6055 area, or the monthly peak touched last week.
The market sentiment remains fragile in the wake of growing concerns that the Israel-Hamas conflict could spill over into the Middle East region, especially after a Gaza hospital reportedly killed hundreds of Palestinians. This, in turn, is seen benefitting the safe-haven US Dollar (USD) and driving flows away from the risk-sensitive Kiwi. Apart from this, growing acceptance that the Federal Reserve (Fed) will keep interest rates higher for longer turns out to be another factor underpinning the Greenback and exerting downward pressure on the NZD/USD pair.
The upbeat US Retail Sales figures released on Tuesday suggested that the economy ended the third quarter on a strong note and lifted Q3 GDP estimates. The data also pushed up fears of sticky inflation, which could allow the Federal Reserve to stick to its hawkish stance and keep interest rates higher for longer. This, in turn, leads to an extended selloff in the US fixed-income market and continues to push the US Treasury bond yields higher. In fact, the yield on the benchmark 10-year government bond jumps to a fresh 16-year peak and moves close to the 5% threshold.
The current market pricing, however, points to a greater chance that the US central bank could hold interest rates steady for the second straight time in November. This, in turn, is holding back the USD bulls from placing aggressive bets, though does little to lend any support to the NZD/USD pair. Traders now look to the US macro data – Weekly Initial Jobless Claims, the Philly Fed Manufacturing Index and Existing Home Sales data – for a fresh impetus. The focus, however, will remain glued to Fed Chair Jerome Powell’s scheduled speech later during the US session.
Technical Levels: Supports and Resistances
NZDUSD currently trading at 0.5829 at the time of writing. Pair opened at 0.5856 and is trading with a change of -0.46 % .
| Overview | Overview.1 | |
|---|---|---|
| 0 | Today last price | 0.5829 |
| 1 | Today Daily Change | -0.0027 |
| 2 | Today Daily Change % | -0.4600 |
| 3 | Today daily open | 0.5856 |
The pair remains strongly bearish on the daily time frame. It trades below the 20 SMA @ 0.5949, 50 SMA 0.5938, 100 SMA @ 0.6053 and 200 SMA @ 0.6155.
| Trends | Trends.1 | |
|---|---|---|
| 0 | Daily SMA20 | 0.5949 |
| 1 | Daily SMA50 | 0.5938 |
| 2 | Daily SMA100 | 0.6053 |
| 3 | Daily SMA200 | 0.6155 |
The previous day high was 0.5921 while the previous day low was 0.5851. The daily 38.2% Fib levels comes at 0.5878, expected to provide resistance. Similarly, the daily 61.8% fib level is at 0.5894, expected to provide resistance.
Note the levels of interest below:
- Pivot support is noted at 0.5831, 0.5806, 0.5761
- Pivot resistance is noted at 0.5901, 0.5946, 0.5971
| Levels | Levels.1 |
|---|---|
| Previous Daily High | 0.5921 |
| Previous Daily Low | 0.5851 |
| Previous Weekly High | 0.6056 |
| Previous Weekly Low | 0.5882 |
| Previous Monthly High | 0.6050 |
| Previous Monthly Low | 0.5847 |
| Daily Fibonacci 38.2% | 0.5878 |
| Daily Fibonacci 61.8% | 0.5894 |
| Daily Pivot Point S1 | 0.5831 |
| Daily Pivot Point S2 | 0.5806 |
| Daily Pivot Point S3 | 0.5761 |
| Daily Pivot Point R1 | 0.5901 |
| Daily Pivot Point R2 | 0.5946 |
| Daily Pivot Point R3 | 0.5971 |
[/s2If]
Download Nehcap EAWe have two EAs that are operational on our LIVE accounts.
- EA-FIX: Check out the details here. Download EA-FIX . EA-FIX is a non-grid HFT scalper.
- EA-GROWTH: High quality low dd EA using trend grids. Download EA_GROWTHJoin Our Telegram Group
")


