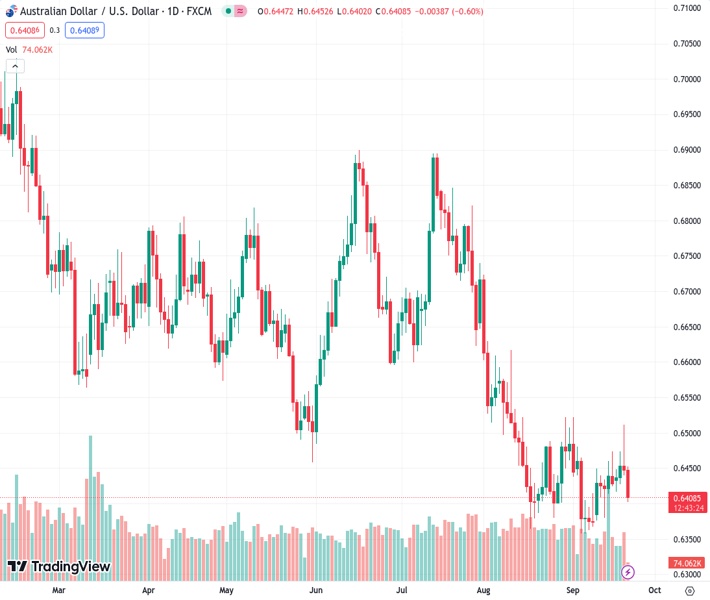
After experiencing losses following the Federal Reserve day, the Australian dollar to US dollar exchange rate, which stands at 0.64093, remains stable above the 0.6400 level.
…
This is a premium post.
[s2If !current_user_can(access_s2member_level4)]Please register for FREE REGISTER to read full post below containing analysis. In case of any error or you think you are not able to read the full post below, please email us at support#nehcap.com [lwa][/s2If] [s2If current_user_can(access_s2member_level1)]
- AUD/USD holds ground above 0.6400 post losses after Fed day.
The pair currently trades last at 0.64093.
The previous day high was 0.6511 while the previous day low was 0.644. The daily 38.2% Fib levels comes at 0.6467, expected to provide resistance. Similarly, the daily 61.8% fib level is at 0.6484, expected to provide resistance.
AUD/USD extends the losses on the second day, trading sideways around 0.6410 during the European session on Thursday. The US Federal Reserve’s (Fed) hawkish stance on interest rates trajectory exerts pressure on the pair.
However, Investors’ attention has been shifted towards the upcoming economic data from the United States (US) and Australia. These data include the US weekly Initial Jobless Claims, the Philadelphia Fed Manufacturing Survey, and the change in Existing Home Sales due for Thursday.
On Friday, preliminary S&P Global PMIs from both countries will be eyed. These reports can provide valuable insights into the health of both economies, which are all important factors influencing trading strategies regarding the AUD/USD pair.
The Australian Dollar (AUD) is affected by China’s cautious approach to implementing additional stimulus measures during periods of economic uncertainty. China is a significant trading partner of Australia, and its economic conditions can have a substantial impact on the Australian economy and, by extension, the value of the AUD against the Greenback.
Additionally, market speculations that the Reserve Bank of Australia (RBA) may have concluded its cycle of interest rate hikes, which contributes support to the prevailing bearish sentiment surrounding the Aussie pair.
The Federal Reserve chose to maintain the current benchmark policy rates at 5.5% during the meeting held on Wednesday. Furthermore, market participants expect that the central bank will pursue an additional rate hike in 2023, following the Federal Open Market Committee’s (FOMC) projection of slightly higher inflation compared to its previous forecasts.
Consequently, Federal Reserve officials unexpectedly adjusted their projected interest rates for 2024, increasing them from 4.6% to 5.1%. This adjustment played a significant role in bolstering the strength of the buck.
The US Dollar Index (DXY), which gauges the Greenback’s performance against six other major currencies, has extended its gains and is trading at a six-month high of around 105.50.
Moreover, the surge in US Treasury yields has contributed to the US Dollar’s strength. The yield on the 10-year US Treasury note stands at 4.41% by the press time, marking the highest level since 2007.
During a press conference held immediately after the rate decision on Wednesday, Federal Reserve Chair Jerome Powell reiterated the Fed’s commitment to achieving its long-term inflation target of 2%. Powell also suggested that the central bank is likely approaching the peak of its interest rate hike cycle, but he emphasized that future policy decisions would continue to rely on data-driven analysis.
Technical Levels: Supports and Resistances
AUDUSD currently trading at 0.6408 at the time of writing. Pair opened at 0.6448 and is trading with a change of -0.62 % .
| Overview | Overview.1 | |
|---|---|---|
| 0 | Today last price | 0.6408 |
| 1 | Today Daily Change | -0.0040 |
| 2 | Today Daily Change % | -0.6200 |
| 3 | Today daily open | 0.6448 |
The pair remains strongly bearish on the daily time frame. It trades below the 20 SMA @ 0.643, 50 SMA 0.6541, 100 SMA @ 0.6611 and 200 SMA @ 0.6699.
| Trends | Trends.1 | |
|---|---|---|
| 0 | Daily SMA20 | 0.6430 |
| 1 | Daily SMA50 | 0.6541 |
| 2 | Daily SMA100 | 0.6611 |
| 3 | Daily SMA200 | 0.6699 |
The previous day high was 0.6511 while the previous day low was 0.644. The daily 38.2% Fib levels comes at 0.6467, expected to provide resistance. Similarly, the daily 61.8% fib level is at 0.6484, expected to provide resistance.
Note the levels of interest below:
- Pivot support is noted at 0.6421, 0.6395, 0.635
- Pivot resistance is noted at 0.6493, 0.6538, 0.6564
| Levels | Levels.1 |
|---|---|
| Previous Daily High | 0.6511 |
| Previous Daily Low | 0.6440 |
| Previous Weekly High | 0.6474 |
| Previous Weekly Low | 0.6378 |
| Previous Monthly High | 0.6724 |
| Previous Monthly Low | 0.6364 |
| Daily Fibonacci 38.2% | 0.6467 |
| Daily Fibonacci 61.8% | 0.6484 |
| Daily Pivot Point S1 | 0.6421 |
| Daily Pivot Point S2 | 0.6395 |
| Daily Pivot Point S3 | 0.6350 |
| Daily Pivot Point R1 | 0.6493 |
| Daily Pivot Point R2 | 0.6538 |
| Daily Pivot Point R3 | 0.6564 |
[/s2If]
Download Nehcap EAWe have two EAs that are operational on our LIVE accounts.
- EA-FIX: Check out the details here. Download EA-FIX . EA-FIX is a non-grid HFT scalper.
- EA-GROWTH: High quality low dd EA using trend grids. Download EA_GROWTHJoin Our Telegram Group


