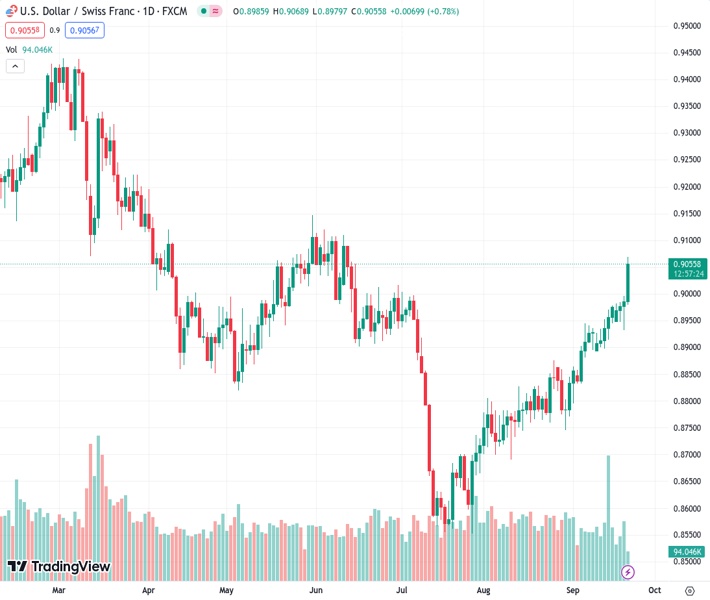
The USDCHF, which was at 0.90525, continues to move upwards and reaches a new high that has not been seen in several months on Thursday.
…
This is a premium post.
[s2If !current_user_can(access_s2member_level4)]Please register for FREE REGISTER to read full post below containing analysis. In case of any error or you think you are not able to read the full post below, please email us at support#nehcap.com [lwa][/s2If] [s2If current_user_can(access_s2member_level1)]
- USD/CHF prolongs its recent upward trajectory and jumps to a fresh multi-month peak on Thursday.
The pair currently trades last at 0.90525.
The previous day high was 0.8996 while the previous day low was 0.8932. The daily 38.2% Fib levels comes at 0.8971, expected to provide support. Similarly, the daily 61.8% fib level is at 0.8956, expected to provide support.
The USD/CHF pair catches aggressive bids during the early part of the European session on Thursday and rallies to its highest level since mid-June after the Swiss National Bank (SNB) announced its policy decision. Spot prices currently trade around mid-0.9000s, with bulls now looking to build on the momentum further beyond a technically significant 200-day Simple Moving Average (SMA) before placing fresh bets.
The Swiss Franc (CHF) weakens across the board after the SNB decided to leave the key policy rate unchanged at 1.75%, defying expectations for one final 25 bps in September. In the accompanying policy statement, the central bank stated that significant tightening of policy in recent quarters is countering remaining inflationary pressure, suggesting that the rate-hiking cycles might be over. This, along with the underlying bullish sentiment surrounding the US Dollar (USD) continues to act as a tailwind for the USD/CHF pair.
In fact, the USD Index (DXY), which tracks the Greenback against a basket of currencies, climbs back closer to a six-month peak and continues to push the USD/CHF pair higher. On Wednesday, the Federal Reserve (Fed) decided to keep interest rates unchanged at a 22-year high, between 5.25%-5.5%, though warned that sticky inflation was likely to attract at least one more interest rate hike in 2023. Furthermore, policymakers now see the benchmark rate at 5.1% next year, suggesting just two rate cuts in 2024 as compared to four projected previously.
This, in turn, reaffirms the higher-for-longer narrative and continues to push the US Treasury bond yields higher. In fact, the yield on the rate-sensitive two-year US government bond has touched its highest level since July 2006. Moreover, the benchmark 10-year Treasury yield rallies to a 16-year peak, which continues to underpin the Greenback and assists the USD/CHF pair to prolong its strong upward trajectory witnessed over the past two months or so. That said, a softer risk tone could benefit the safe-haven CHF and keep a lid on any further gains.
Market participants now look to the US economic docket – featuring the release of the usual Weekly Initial Jobless Claims, the Philly Fed Manufacturing Index and Existing Home Sales data later during the early North American session. This, along with the US bond yields, should influence the USD price dynamics and provide some impetus to the USD/CHF pair. Traders will further take cues from the broader risk sentiment to grab short-term opportunities. The fundamental backdrop, meanwhile, suggests that the path of least resistance remains up.
Technical Levels: Supports and Resistances
USDCHF currently trading at 0.8988 at the time of writing. Pair opened at 0.8986 and is trading with a change of 0.02 % .
| Overview | Overview.1 | |
|---|---|---|
| 0 | Today last price | 0.8988 |
| 1 | Today Daily Change | 0.0002 |
| 2 | Today Daily Change % | 0.0200 |
| 3 | Today daily open | 0.8986 |
The pair is trading above its 20 Daily moving average @ 0.8896, above its 50 Daily moving average @ 0.8788 , above its 100 Daily moving average @ 0.8882 and below its 200 Daily moving average @ 0.9037
| Trends | Trends.1 | |
|---|---|---|
| 0 | Daily SMA20 | 0.8896 |
| 1 | Daily SMA50 | 0.8788 |
| 2 | Daily SMA100 | 0.8882 |
| 3 | Daily SMA200 | 0.9037 |
The previous day high was 0.8996 while the previous day low was 0.8932. The daily 38.2% Fib levels comes at 0.8971, expected to provide support. Similarly, the daily 61.8% fib level is at 0.8956, expected to provide support.
Note the levels of interest below:
- Pivot support is noted at 0.8947, 0.8908, 0.8884
- Pivot resistance is noted at 0.9011, 0.9035, 0.9074
| Levels | Levels.1 |
|---|---|
| Previous Daily High | 0.8996 |
| Previous Daily Low | 0.8932 |
| Previous Weekly High | 0.8978 |
| Previous Weekly Low | 0.8897 |
| Previous Monthly High | 0.8876 |
| Previous Monthly Low | 0.8690 |
| Daily Fibonacci 38.2% | 0.8971 |
| Daily Fibonacci 61.8% | 0.8956 |
| Daily Pivot Point S1 | 0.8947 |
| Daily Pivot Point S2 | 0.8908 |
| Daily Pivot Point S3 | 0.8884 |
| Daily Pivot Point R1 | 0.9011 |
| Daily Pivot Point R2 | 0.9035 |
| Daily Pivot Point R3 | 0.9074 |
[/s2If]
Download Nehcap EAWe have two EAs that are operational on our LIVE accounts.
- EA-FIX: Check out the details here. Download EA-FIX . EA-FIX is a non-grid HFT scalper.
- EA-GROWTH: High quality low dd EA using trend grids. Download EA_GROWTHJoin Our Telegram Group


