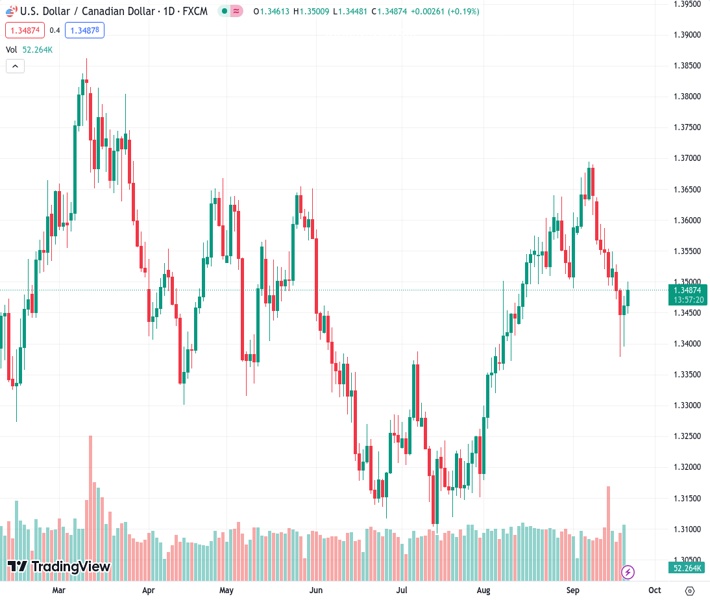
The USDCAD currency pair has picked up momentum around the 1.3500 psychological level due to the strengthening US dollar.
…
This is a premium post.
[s2If !current_user_can(access_s2member_level4)]Please register for FREE REGISTER to read full post below containing analysis. In case of any error or you think you are not able to read the full post below, please email us at support#nehcap.com [lwa][/s2If] [s2If current_user_can(access_s2member_level1)]
- USD/CAD gains traction near the 1.3500 psychological mark amid the renewed USD.
The pair currently trades last at 1.34899.
The previous day high was 1.3477 while the previous day low was 1.3396. The daily 38.2% Fib levels comes at 1.3446, expected to provide support. Similarly, the daily 61.8% fib level is at 1.3427, expected to provide support.
The USD/CAD pair trades in positive territory for the second straight day during the early European session on Thursday. The pair’s recovery is bolstered by the Federal Reserve’s (Fed) hawkish stance after holding the interest rate unchanged in its policy meeting on Wednesday. Additionally, a decline in oil prices weighs on the commodity-linked Loonie as the country is the leading oil exporter to the United States. The pair currently trades near 1.3495, gaining 0.26% on the day.
According to the four-hour chart, USD/CAD holds below the 50- and 100-hour Exponential Moving Averages (EMAs) with a downward slope, which supports the sellers for the time being.
The first resistance level for the pair is seen near the 50-hour EMA at 1.3510. The additional upside filter to watch is near the confluence of the 100-hour EMA and the upper boundary of the Bollinger Band at 1.3530. Any follow-through buying above the latter will pave the way to a high of September 13 at 1.3586, followed by a psychological round figure at 1.3600.
Looking at the downside, the initial support level is located at 1.3465 (a high of September 20). The critical contention is seen at the 1.3400-1.3410 region, representing a psychological figure, the lower limit of Bollinger Band and a low of August 11. Further south, the next downside stop will emerge at 1.3380 (a low of September 19).
It’s worth noting that the Relative Strength Index (RSI) stands above 50, activating the bullish momentum for the USD/CAD pair for the USD/CAD pair.
Technical Levels: Supports and Resistances
USDCAD currently trading at 1.3496 at the time of writing. Pair opened at 1.3462 and is trading with a change of 0.25 % .
| Overview | Overview.1 | |
|---|---|---|
| 0 | Today last price | 1.3496 |
| 1 | Today Daily Change | 0.0034 |
| 2 | Today Daily Change % | 0.2500 |
| 3 | Today daily open | 1.3462 |
The pair is trading below its 20 Daily moving average @ 1.3563, above its 50 Daily moving average @ 1.3428 , above its 100 Daily moving average @ 1.3399 and above its 200 Daily moving average @ 1.3463
| Trends | Trends.1 | |
|---|---|---|
| 0 | Daily SMA20 | 1.3563 |
| 1 | Daily SMA50 | 1.3428 |
| 2 | Daily SMA100 | 1.3399 |
| 3 | Daily SMA200 | 1.3463 |
The previous day high was 1.3477 while the previous day low was 1.3396. The daily 38.2% Fib levels comes at 1.3446, expected to provide support. Similarly, the daily 61.8% fib level is at 1.3427, expected to provide support.
Note the levels of interest below:
- Pivot support is noted at 1.3412, 1.3363, 1.3331
- Pivot resistance is noted at 1.3494, 1.3527, 1.3576
| Levels | Levels.1 |
|---|---|
| Previous Daily High | 1.3477 |
| Previous Daily Low | 1.3396 |
| Previous Weekly High | 1.3639 |
| Previous Weekly Low | 1.3493 |
| Previous Monthly High | 1.3640 |
| Previous Monthly Low | 1.3184 |
| Daily Fibonacci 38.2% | 1.3446 |
| Daily Fibonacci 61.8% | 1.3427 |
| Daily Pivot Point S1 | 1.3412 |
| Daily Pivot Point S2 | 1.3363 |
| Daily Pivot Point S3 | 1.3331 |
| Daily Pivot Point R1 | 1.3494 |
| Daily Pivot Point R2 | 1.3527 |
| Daily Pivot Point R3 | 1.3576 |
[/s2If]
Download Nehcap EAWe have two EAs that are operational on our LIVE accounts.
- EA-FIX: Check out the details here. Download EA-FIX . EA-FIX is a non-grid HFT scalper.
- EA-GROWTH: High quality low dd EA using trend grids. Download EA_GROWTHJoin Our Telegram Group


