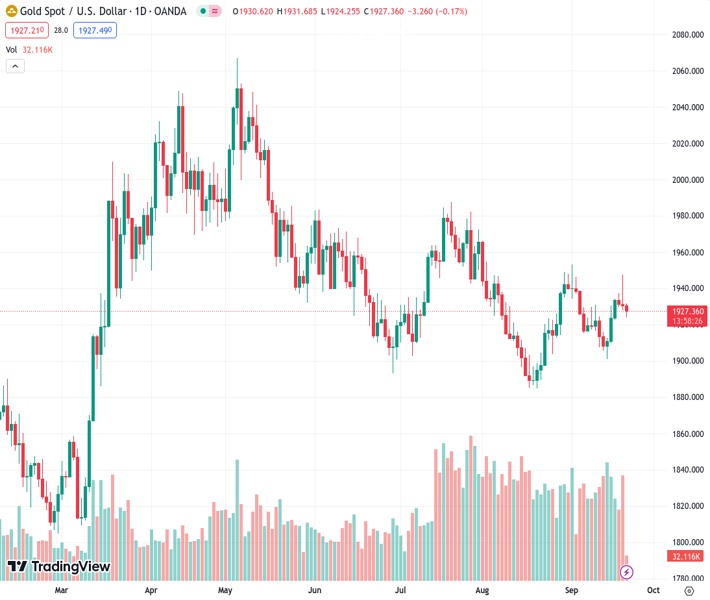
The price of gold, at $1,928.36, remains stable near the $1,930 mark in anticipation of upcoming US economic data.
…
This is a premium post.
[s2If !current_user_can(access_s2member_level4)]Please register for FREE REGISTER to read full post below containing analysis. In case of any error or you think you are not able to read the full post below, please email us at support#nehcap.com [lwa][/s2If] [s2If current_user_can(access_s2member_level1)]
- Gold price maintains its position around $1,930 ahead of US economic data.
The pair currently trades last at 1928.36.
The previous day high was 1947.47 while the previous day low was 1927.99. The daily 38.2% Fib levels comes at 1935.43, expected to provide resistance. Similarly, the daily 61.8% fib level is at 1940.03, expected to provide resistance.
Gold price hovers around $1,930 during the early trading hours of the European session on Thursday. Investors seem to shift their focus on upcoming US data after the US Federal Reserve’s (Fed) decision on policy rates.
However, the Fed’s hawkish stance on interest rates trajectory exerts pressure on the prices of the yellow metal.
As expected, the Federal Reserve opted to maintain the current benchmark policy rates at 5.5% during the meeting held on Wednesday.
Moreover, it is anticipated that the central bank will pursue an additional rate hike in 2023, in line with the Federal Open Market Committee’s (FOMC) projection of slightly higher inflation compared to its previous forecasts.
Hence, Federal Reserve officials unexpectedly revised their projected interest rates for 2024, increasing them from 4.6% to 5.1%. This adjustment played a significant role in supporting the US Dollar (USD).
The US Dollar Index (DXY), which measures the Greenback’s performance against six other major currencies, extends its gains and trades at a six-month high of around 105.50.
Additionally, higher US Treasury yields have contributed to the US Dollar’s strength and increased the opportunity cost of holding non-interest-bearing assets like Gold. The yield on the 10-year US Treasury note has risen to 4.43%, the highest level since 2007.
Moreover, in a press conference held immediately after the rate decision on Wednesday, Federal Reserve Chair Jerome Powell reiterated the Fed’s commitment to achieving its long-term inflation target of 2%. Powell also suggested that the central bank is likely approaching the peak of its interest rate hike cycle, but he emphasized that future policy decisions would be based on data-driven analysis.
Investors will closely monitor the upcoming data releases from the United States (US) scheduled for Thursday. This data includes the weekly Initial Jobless Claims, the Philadelphia Fed Manufacturing Survey, and the change in Existing Home Sales.
These reports can provide valuable insights into the health of the US labor market, manufacturing sector, and real estate market, which are all important factors influencing economic sentiment.
Technical Levels: Supports and Resistances
XAUUSD currently trading at 1928.64 at the time of writing. Pair opened at 1930.34 and is trading with a change of -0.09 % .
| Overview | Overview.1 | |
|---|---|---|
| 0 | Today last price | 1928.64 |
| 1 | Today Daily Change | -1.70 |
| 2 | Today Daily Change % | -0.09 |
| 3 | Today daily open | 1930.34 |
The pair is trading above its 20 Daily moving average @ 1925.31, below its 50 Daily moving average @ 1931.44 , below its 100 Daily moving average @ 1944.49 and above its 200 Daily moving average @ 1924.26
| Trends | Trends.1 | |
|---|---|---|
| 0 | Daily SMA20 | 1925.31 |
| 1 | Daily SMA50 | 1931.44 |
| 2 | Daily SMA100 | 1944.49 |
| 3 | Daily SMA200 | 1924.26 |
The previous day high was 1947.47 while the previous day low was 1927.99. The daily 38.2% Fib levels comes at 1935.43, expected to provide resistance. Similarly, the daily 61.8% fib level is at 1940.03, expected to provide resistance.
Note the levels of interest below:
- Pivot support is noted at 1923.06, 1915.79, 1903.58
- Pivot resistance is noted at 1942.54, 1954.75, 1962.02
| Levels | Levels.1 |
|---|---|
| Previous Daily High | 1947.47 |
| Previous Daily Low | 1927.99 |
| Previous Weekly High | 1930.77 |
| Previous Weekly Low | 1901.07 |
| Previous Monthly High | 1966.08 |
| Previous Monthly Low | 1884.85 |
| Daily Fibonacci 38.2% | 1935.43 |
| Daily Fibonacci 61.8% | 1940.03 |
| Daily Pivot Point S1 | 1923.06 |
| Daily Pivot Point S2 | 1915.79 |
| Daily Pivot Point S3 | 1903.58 |
| Daily Pivot Point R1 | 1942.54 |
| Daily Pivot Point R2 | 1954.75 |
| Daily Pivot Point R3 | 1962.02 |
[/s2If]
Download Nehcap EAWe have two EAs that are operational on our LIVE accounts.
- EA-FIX: Check out the details here. Download EA-FIX . EA-FIX is a non-grid HFT scalper.
- EA-GROWTH: High quality low dd EA using trend grids. Download EA_GROWTHJoin Our Telegram Group


