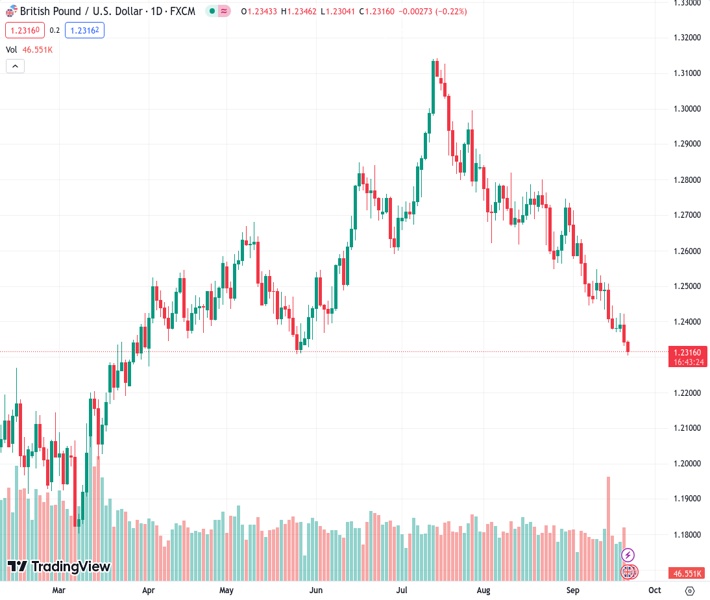
The GBP/USD currency pair, currently trading at 1.23158, continues to experience declines for the second day in a row due to the Federal Reserve’s more aggressive stance on monetary policy.
…
This is a premium post.
[s2If !current_user_can(access_s2member_level4)]Please register for FREE REGISTER to read full post below containing analysis. In case of any error or you think you are not able to read the full post below, please email us at support#nehcap.com [lwa][/s2If] [s2If current_user_can(access_s2member_level1)]
- GBP/USD extends its losses on the second successive day on the Fed’s hawkish tone.
The pair currently trades last at 1.23158.
The previous day high was 1.2421 while the previous day low was 1.2332. The daily 38.2% Fib levels comes at 1.2366, expected to provide resistance. Similarly, the daily 61.8% fib level is at 1.2387, expected to provide resistance.
GBP/USD expands losses on the second successive day, trading lower around 1.2320 during the Asian session on Thursday. US Federal Reserve’s (Fed) hawkish stance exerts downward pressure on the pair.
As anticipated, the Fed chose to keep the existing benchmark policy rates unchanged at 5.5% during the meeting held on Wednesday.
The central bank is expected to attempt an additional rate hike in 2023, following the Federal Open Market Committee’s (FOMC) expectation for slightly elevated inflation compared to its previous forecasts.
Therefore, Fed officials unexpectedly revised their projected interest rates for 2024, increasing them from 4.6% to 5.1%, which contributes to the support in underpinning the US Dollar (USD).
US Dollar Index (DXY), which gauges the performance of the Greenback against the six other major currencies, extends its gains and trades a six-month high of around 105.50 at the time of writing. Additionally, Higher US Treasury yields help the buck to rise.
The yield on 10-year US note rose to 4.43% by the press time, the highest since 2007.
Furthermore, during a press conference held immediately after the rate decision, Federal Reserve Chair Jerome Powell reiterated the Fed’s dedication to achieving its long-term inflation target of 2%.
Powell indicated that the central bank is probably nearing the apex of its interest rate hike cycle, yet he underscored that forthcoming policy determination would hinge on data-driven analysis.
On the GBP side, the anticipation of an imminent halt in the Bank of England’s (BoE) cycle of raising interest rates continues to exert downward pressure on the British Pound, causing the GBP/USD pair to decline.
Market sentiment experienced a significant shift following the release of UK data on Wednesday, which showed that the annual headline Consumer Price Index (CPI) dropped to 6.7% in August from 6.8% in July, contradicting the consensus forecast of an increase to 7.1%.
Moreover, the core CPI registered at 6.2% for the 12 months ending in August, down from 6.9% in July. These developments occurred alongside resurfacing concerns of a potential economic downturn and signs of a cooling labor market in the UK, aligning with market expectations.
Consequently, the focal point will remain fixed on the eagerly awaited policy decision by the Bank of England, set to be announced later in the day.
Investors will likely watch the upcoming data release from the United States (US) due on Thursday, including the weekly Initial Jobless Claims, Philadelphia Fed Manufacturing Survey, and Existing Home Sales Change.
Technical Levels: Supports and Resistances
GBPUSD currently trading at 1.2322 at the time of writing. Pair opened at 1.2344 and is trading with a change of -0.18 % .
| Overview | Overview.1 | |
|---|---|---|
| 0 | Today last price | 1.2322 |
| 1 | Today Daily Change | -0.0022 |
| 2 | Today Daily Change % | -0.1800 |
| 3 | Today daily open | 1.2344 |
The pair remains strongly bearish on the daily time frame. It trades below the 20 SMA @ 1.2523, 50 SMA 1.27, 100 SMA @ 1.2649 and 200 SMA @ 1.2433.
| Trends | Trends.1 | |
|---|---|---|
| 0 | Daily SMA20 | 1.2523 |
| 1 | Daily SMA50 | 1.2700 |
| 2 | Daily SMA100 | 1.2649 |
| 3 | Daily SMA200 | 1.2433 |
The previous day high was 1.2421 while the previous day low was 1.2332. The daily 38.2% Fib levels comes at 1.2366, expected to provide resistance. Similarly, the daily 61.8% fib level is at 1.2387, expected to provide resistance.
Note the levels of interest below:
- Pivot support is noted at 1.231, 1.2277, 1.2221
- Pivot resistance is noted at 1.24, 1.2455, 1.2489
| Levels | Levels.1 |
|---|---|
| Previous Daily High | 1.2421 |
| Previous Daily Low | 1.2332 |
| Previous Weekly High | 1.2548 |
| Previous Weekly Low | 1.2379 |
| Previous Monthly High | 1.2841 |
| Previous Monthly Low | 1.2548 |
| Daily Fibonacci 38.2% | 1.2366 |
| Daily Fibonacci 61.8% | 1.2387 |
| Daily Pivot Point S1 | 1.2310 |
| Daily Pivot Point S2 | 1.2277 |
| Daily Pivot Point S3 | 1.2221 |
| Daily Pivot Point R1 | 1.2400 |
| Daily Pivot Point R2 | 1.2455 |
| Daily Pivot Point R3 | 1.2489 |
[/s2If]
Download Nehcap EAWe have two EAs that are operational on our LIVE accounts.
- EA-FIX: Check out the details here. Download EA-FIX . EA-FIX is a non-grid HFT scalper.
- EA-GROWTH: High quality low dd EA using trend grids. Download EA_GROWTHJoin Our Telegram Group
")


