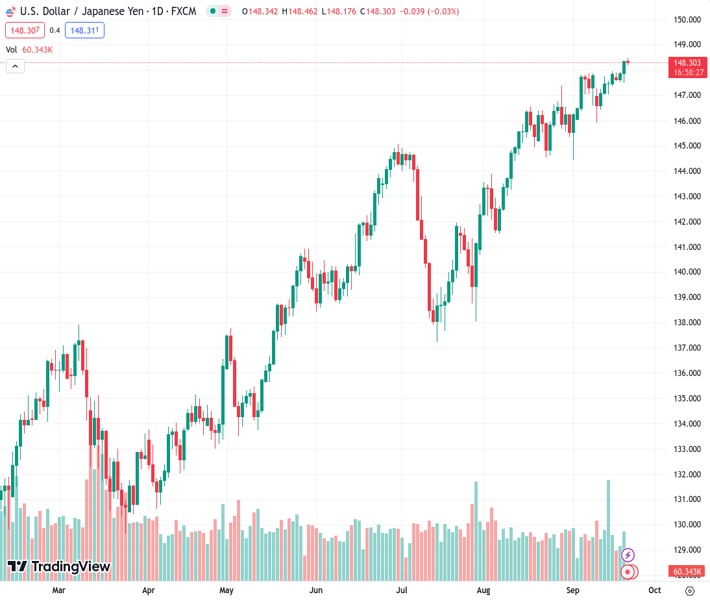
The USDJPY pair, which was previously at its highest level of the year earlier on Thursday at 148.286, has slightly dropped but is not experiencing a significant continuation in its decrease.
…
This is a premium post.
[s2If !current_user_can(access_s2member_level4)]Please register for FREE REGISTER to read full post below containing analysis. In case of any error or you think you are not able to read the full post below, please email us at support#nehcap.com [lwa][/s2If] [s2If current_user_can(access_s2member_level1)]
- USD/JPY eases from the YTD peak touched earlier this Thursday, though lacks follow-through.
The pair currently trades last at 148.286.
The previous day high was 148.36 while the previous day low was 147.48. The daily 38.2% Fib levels comes at 148.02, expected to provide support. Similarly, the daily 61.8% fib level is at 147.81, expected to provide support.
The USD/JPY pair pulls back after hitting a fresh YTD peak, around the 148.45 region during the Asian session this Thursday, albeit lacks follow-through and manages to hold above the daily trough. Spot prices currently trade around the 148.25 area, down less than 0.10% for the day, and seem poised to appreciate further.
Against the backdrop of the recent breakout through the 146.50-146.60 strong horizontal barrier, the overnight sustained strength and a daily close above the 148.00 mark could be seen as a fresh trigger for bullish traders. The positive outlook for the USD/JPY pair is reinforced by the underlying bullish sentiment surrounding the US Dollar (USD), bolstered by the Federal Reserve’s (Fed) hawkish outlook.
That said, comments by Japan’s Chief Cabinet Secretary Hirokazu Matsuno, saying that he won’t rule out any options for response to FX moves, raises the risk of an intervention by authorities to prop up the domestic currency. Apart from this, speculations that the Bank of Japan (BoJ) could move away from the negative interest rates policy benefit the Japanese Yen (JPY) and cap the upside for the USD/JPY pair.
Technical indicators on the daily chart, meanwhile, are holding comfortably in the positive territory and are still far from being in the overbought zone. This, in turn, favours bullish traders and suggests that the path of least resistance for the USD/JPY pair is to the upside. Hence, any meaningful corrective decline below the 148.00 round figure might still be seen as a buying opportunity near the 147.70-147.65 area
The latter is closely followed by the weekly trough, around mid-147.00s, which if broken decisively might prompt some technical selling and drag the USD/JPY pair back towards the 147.00 round figure. Spot prices could then slide to the 146.50 horizontal support before eventually dropping to last week’s swing low or sub-146.00 levels.
On the flip side, bulls might now wait for some follow-through strength beyond the 148.45 region, or the daily peak, before placing fresh bets. The subsequent move up has the potential to lift the USD/JPY pair towards the next relevant hurdle near the 148.80-148.85 region en route to the 149.00 round figure. The momentum could get extended further to the 149.70 area, above which spot prices could aim to reclaim the 150.00 psychological mark for the first time since October 2022.
Technical Levels: Supports and Resistances
USDJPY currently trading at 148.27 at the time of writing. Pair opened at 148.35 and is trading with a change of -0.05 % .
| Overview | Overview.1 | |
|---|---|---|
| 0 | Today last price | 148.27 |
| 1 | Today Daily Change | -0.08 |
| 2 | Today Daily Change % | -0.05 |
| 3 | Today daily open | 148.35 |
The pair remains strongly bullish on the daily timeframe. It trades above its 20 SMA @ 147.0, 50 SMA 144.35, 100 SMA @ 142.17 and 200 SMA @ 137.53.
| Trends | Trends.1 | |
|---|---|---|
| 0 | Daily SMA20 | 147.00 |
| 1 | Daily SMA50 | 144.35 |
| 2 | Daily SMA100 | 142.17 |
| 3 | Daily SMA200 | 137.53 |
The previous day high was 148.36 while the previous day low was 147.48. The daily 38.2% Fib levels comes at 148.02, expected to provide support. Similarly, the daily 61.8% fib level is at 147.81, expected to provide support.
Note the levels of interest below:
- Pivot support is noted at 147.76, 147.17, 146.87
- Pivot resistance is noted at 148.65, 148.95, 149.53
| Levels | Levels.1 |
|---|---|
| Previous Daily High | 148.36 |
| Previous Daily Low | 147.48 |
| Previous Weekly High | 147.95 |
| Previous Weekly Low | 145.90 |
| Previous Monthly High | 147.38 |
| Previous Monthly Low | 141.51 |
| Daily Fibonacci 38.2% | 148.02 |
| Daily Fibonacci 61.8% | 147.81 |
| Daily Pivot Point S1 | 147.76 |
| Daily Pivot Point S2 | 147.17 |
| Daily Pivot Point S3 | 146.87 |
| Daily Pivot Point R1 | 148.65 |
| Daily Pivot Point R2 | 148.95 |
| Daily Pivot Point R3 | 149.53 |
[/s2If]
Download Nehcap EAWe have two EAs that are operational on our LIVE accounts.
- EA-FIX: Check out the details here. Download EA-FIX . EA-FIX is a non-grid HFT scalper.
- EA-GROWTH: High quality low dd EA using trend grids. Download EA_GROWTHJoin Our Telegram Group
")


