The USD/MXN exchange rate has increased as a result of the Federal Reserve’s more aggressive stance on the direction of interest rates.
…
This is a premium post.
[s2If !current_user_can(access_s2member_level4)]Please register for FREE REGISTER to read full post below containing analysis. In case of any error or you think you are not able to read the full post below, please email us at support#nehcap.com [lwa][/s2If] [s2If current_user_can(access_s2member_level1)]
- USD/MXN trades higher on the back of the Fed’s hawkish stance on interest rates trajectory.
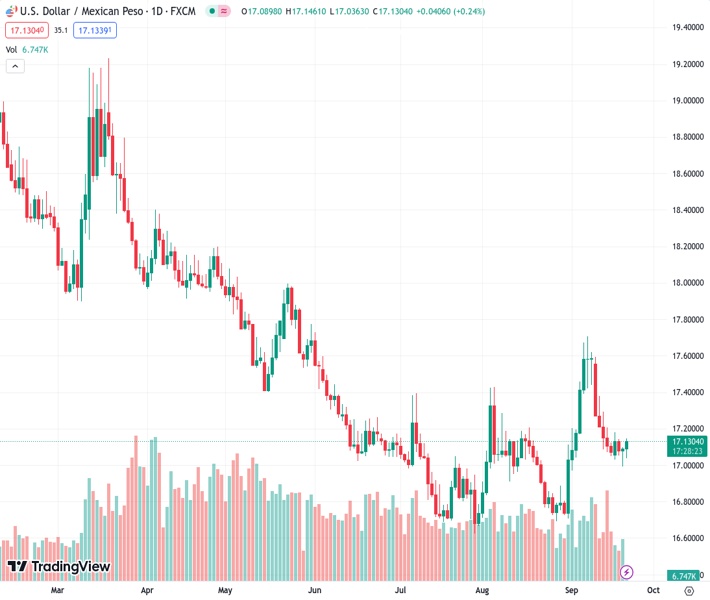
The pair currently trades last at 17.1335.
The previous day high was 17.1 while the previous day low was 16.9982. The daily 38.2% Fib levels comes at 17.0611, expected to provide support. Similarly, the daily 61.8% fib level is at 17.0371, expected to provide support.
USD/MXN continues to gain on the second successive day, trading higher around 17.1340 during the Asian session on Thursday. As anticipated, the US Federal Reserve (Fed) opted to keep the existing benchmark policy rates unchanged at 5.5% during the meeting held on Wednesday.
Fed projected an additional rate hike in 2023, which reinforces the strength of the USD/MXN pair. Moreover, in its monetary policy statement, the Federal Open Market Committee (FOMC) has revealed its expectation for slightly elevated inflation compared to its previous forecasts.
The immediate support for the USD/MXN pair appears around the 17.0000 psychological level lined up with the weekly low at 16.9985.
A break below the latter could help the pair to navigate the region around the 16.9000 psychological level.
On the upside, the seven-day Exponential Moving Average (EMA) at 17.1394 emerges as the immediate barrier, following the 17.1500 psychological level.
A firm break above the level could inspire the USD/MXN bulls to explore the region around the 17.1600 level aligned to the 23.6% Fibonacci retracement at the 17.1626 level.
The Moving Average Convergence Divergence (MACD) line remains above the centerline, but it exhibits a pattern of divergence beneath the signal line. This pattern indicates that the recent strength in the USD/MXN pair may perish.
However, the pair’s momentum is neutral as the 14-day Relative Strength Index (RSI) lies on the 50 level.
Technical Levels: Supports and Resistances
USDMXN currently trading at 17.1328 at the time of writing. Pair opened at 17.0923 and is trading with a change of 0.24 % .
| Overview | Overview.1 | |
|---|---|---|
| 0 | Today last price | 17.1328 |
| 1 | Today Daily Change | 0.0405 |
| 2 | Today Daily Change % | 0.2400 |
| 3 | Today daily open | 17.0923 |
The pair is trading above its 20 Daily moving average @ 17.1281, above its 50 Daily moving average @ 17.0213 , below its 100 Daily moving average @ 17.2079 and below its 200 Daily moving average @ 17.9176
| Trends | Trends.1 | |
|---|---|---|
| 0 | Daily SMA20 | 17.1281 |
| 1 | Daily SMA50 | 17.0213 |
| 2 | Daily SMA100 | 17.2079 |
| 3 | Daily SMA200 | 17.9176 |
The previous day high was 17.1 while the previous day low was 16.9982. The daily 38.2% Fib levels comes at 17.0611, expected to provide support. Similarly, the daily 61.8% fib level is at 17.0371, expected to provide support.
Note the levels of interest below:
- Pivot support is noted at 17.027, 16.9618, 16.9253
- Pivot resistance is noted at 17.1288, 17.1652, 17.2305
| Levels | Levels.1 |
|---|---|
| Previous Daily High | 17.1000 |
| Previous Daily Low | 16.9982 |
| Previous Weekly High | 17.5959 |
| Previous Weekly Low | 17.0504 |
| Previous Monthly High | 17.4274 |
| Previous Monthly Low | 16.6945 |
| Daily Fibonacci 38.2% | 17.0611 |
| Daily Fibonacci 61.8% | 17.0371 |
| Daily Pivot Point S1 | 17.0270 |
| Daily Pivot Point S2 | 16.9618 |
| Daily Pivot Point S3 | 16.9253 |
| Daily Pivot Point R1 | 17.1288 |
| Daily Pivot Point R2 | 17.1652 |
| Daily Pivot Point R3 | 17.2305 |
[/s2If]
Download Nehcap EAWe have two EAs that are operational on our LIVE accounts.
- EA-FIX: Check out the details here. Download EA-FIX . EA-FIX is a non-grid HFT scalper.
- EA-GROWTH: High quality low dd EA using trend grids. Download EA_GROWTHJoin Our Telegram Group
")


