The US dollar to Canadian dollar exchange rate is showing signs of improving near the 1.3485 level due to increased demand for the US dollar.
…
This is a premium post.
[s2If !current_user_can(access_s2member_level4)]Please register for FREE REGISTER to read full post below containing analysis. In case of any error or you think you are not able to read the full post below, please email us at support#nehcap.com [lwa][/s2If] [s2If current_user_can(access_s2member_level1)]
- USD/CAD gains traction around 1.3485 amid the renewed USD demand.
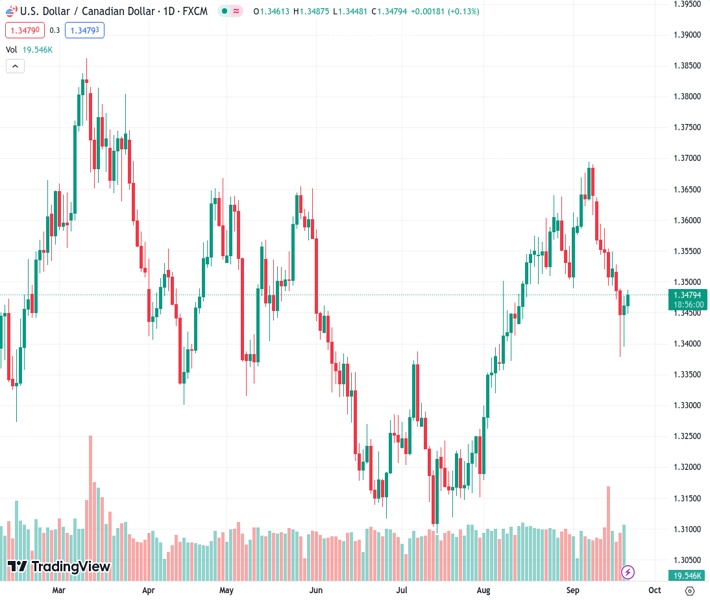
The pair currently trades last at 1.34787.
The previous day high was 1.3477 while the previous day low was 1.3396. The daily 38.2% Fib levels comes at 1.3446, expected to provide support. Similarly, the daily 61.8% fib level is at 1.3427, expected to provide support.
The USD/CAD extends its upside and trades in positive territory for the second consecutive day during the early Asian session on Thursday. The rebound in the pair is supported by the hawkish stance of the Federal Reserve (Fed) after its policy meeting on Wednesday and the revised interest rate expectations for 2024. The pair currently trades near 1.3485, gaining 0.18% on the day.
At its September meeting, The Federal Reserve (Fed) kept interest rates unchanged at 5.25-5.50% as widely expected in the market. Officials are becoming more confident that they could lower inflation without harming the economy or causing major job losses.
In a press conference, Fed Chairman Jerome Powell reaffirmed the Fed’s commitment to achieving 2% inflation. He added that maintaining rates does not indicate the Fed’s policy stance, and the US central bank is ready to raise rates if necessary. According to the Fed’s most recent quarterly predictions, the benchmark overnight interest rate may be hiked one more time this year to a peak range of 5.50% to 5.75%, and rates could be significantly tighter through 2024 than previously anticipated.
Additionally, the Fed revised its Summary of Projections (SEP), indicating that Fed officials estimate the interest rate to hit 5.1% by the end of 2024 (from 4.6% prior). The higher-for-longer rate narrative has propelled the US Dollar against its rivals and acts as a tailwind for the USD/CAD pair.
On the Loonie front, a decline in oil price has undermined the commodity-linked Loonie as the country is the leading oil exporter to the United States. Data released on Tuesday showed that Canadian Consumer Price Index (CPI) in August surged to 4.0% YoY from 3.3% in July. Meanwhile, the core CPI that excludes volatile oil and food prices rose to 3.3% YoY from 3.2% in the previous reading. These figures might convince the Bank of Canada (BoC) to raise interest rates yet further.
In a speech after the publication of the data, BoC Deputy Governor Sharon Kozicki said that ups and downs of the size we’ve seen in the past couple of months are not that unusual which is why the central bank focuses on measures of core inflation.
Looking ahead, the US weekly Jobless Claims, the Philly Fed, and Existing Home Sales will be due on Thursday. On Friday, the preliminary US S&P Global PMI for September and Canadian Retail Sales for July will be released. Traders will take cues from these data and find trading opportunities around The USD/CAD pair.
Technical Levels: Supports and Resistances
USDCAD currently trading at 1.3484 at the time of writing. Pair opened at 1.3462 and is trading with a change of 0.16 % .
| Overview | Overview.1 | |
|---|---|---|
| 0 | Today last price | 1.3484 |
| 1 | Today Daily Change | 0.0022 |
| 2 | Today Daily Change % | 0.1600 |
| 3 | Today daily open | 1.3462 |
The pair is trading below its 20 Daily moving average @ 1.3563, above its 50 Daily moving average @ 1.3428 , above its 100 Daily moving average @ 1.3399 and above its 200 Daily moving average @ 1.3463
| Trends | Trends.1 | |
|---|---|---|
| 0 | Daily SMA20 | 1.3563 |
| 1 | Daily SMA50 | 1.3428 |
| 2 | Daily SMA100 | 1.3399 |
| 3 | Daily SMA200 | 1.3463 |
The previous day high was 1.3477 while the previous day low was 1.3396. The daily 38.2% Fib levels comes at 1.3446, expected to provide support. Similarly, the daily 61.8% fib level is at 1.3427, expected to provide support.
Note the levels of interest below:
- Pivot support is noted at 1.3412, 1.3363, 1.3331
- Pivot resistance is noted at 1.3494, 1.3527, 1.3576
| Levels | Levels.1 |
|---|---|
| Previous Daily High | 1.3477 |
| Previous Daily Low | 1.3396 |
| Previous Weekly High | 1.3639 |
| Previous Weekly Low | 1.3493 |
| Previous Monthly High | 1.3640 |
| Previous Monthly Low | 1.3184 |
| Daily Fibonacci 38.2% | 1.3446 |
| Daily Fibonacci 61.8% | 1.3427 |
| Daily Pivot Point S1 | 1.3412 |
| Daily Pivot Point S2 | 1.3363 |
| Daily Pivot Point S3 | 1.3331 |
| Daily Pivot Point R1 | 1.3494 |
| Daily Pivot Point R2 | 1.3527 |
| Daily Pivot Point R3 | 1.3576 |
[/s2If]
Download Nehcap EAWe have two EAs that are operational on our LIVE accounts.
- EA-FIX: Check out the details here. Download EA-FIX . EA-FIX is a non-grid HFT scalper.
- EA-GROWTH: High quality low dd EA using trend grids. Download EA_GROWTHJoin Our Telegram Group


