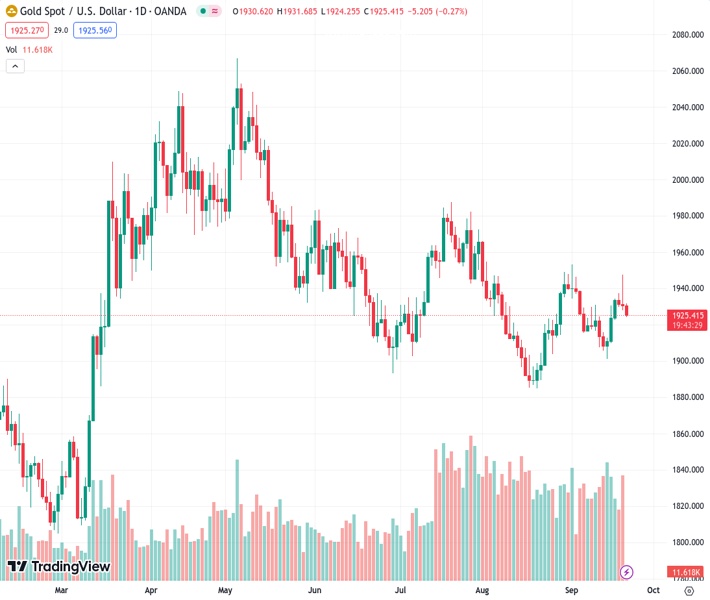
The value of gold, represented by #XAUUSD at 1,925.01, continues to decline following the Federal Reserve’s decision on interest rates.
…
This is a premium post.
[s2If !current_user_can(access_s2member_level4)]Please register for FREE REGISTER to read full post below containing analysis. In case of any error or you think you are not able to read the full post below, please email us at support#nehcap.com [lwa][/s2If] [s2If current_user_can(access_s2member_level1)]
- Gold price continues to lose after the Fed interest rate decision.
The pair currently trades last at 1925.01.
The previous day high was 1947.47 while the previous day low was 1927.99. The daily 38.2% Fib levels comes at 1935.43, expected to provide resistance. Similarly, the daily 61.8% fib level is at 1940.03, expected to provide resistance.
Gold price extends losses on the third consecutive day, trading lower around $1,925 during the early trading hours of the Asian session on Thursday. As expected, the US Federal Reserve (Fed) maintained current benchmark policy rates at 5.5% in the meeting held on Wednesday.
The price of precious metal is facing downward pressure as the Fed projects an additional rate hike in 2023. Furthermore, the Federal Open Market Committee (FOMC) has disclosed in its monetary policy statement, anticipating slightly higher inflation than its previous forecasts.
Although the monetary policy statement remained largely consistent with the previous decision, the unexpected surge in the value of the US Dollar (USD) was primarily driven by the Fed officials’ decision to revise their projected interest rates for 2024, elevating them from 4.6% to 5.1%. This adjustment played a pivotal role in the rapid appreciation of the Greenback.
US Dollar Index (DXY), which measures the performance of the US Dollar (USD) against the six other major currencies, continues to gain and trades around a six-month high level at 105.60 at the time of writing.
US Treasury yields rose, with the 10-year rising to 4.43% by the press time, the highest since 2007, boosting the Greenback.
The precious metal slipped after Fed Chair Jerome Powell’s press conference to outline the Fed’s position. Powell reaffirmed the Fed’s commitment to reaching its long-term inflation target of 2%.
While he acknowledged that the Fed is likely approaching the peak of its interest rate hike cycle, he emphasized that the Fed will continue to make its future decisions based on data-driven analysis.
The impact of the Fed meeting will continue on Thursday when more US data is due with the weekly Initial Jobless Claims, Philadelphia Fed Manufacturing Survey, and Existing Home Sales Change.
Technical Levels: Supports and Resistances
XAUUSD currently trading at 1925.05 at the time of writing. Pair opened at 1930.34 and is trading with a change of -0.27 % .
| Overview | Overview.1 | |
|---|---|---|
| 0 | Today last price | 1925.05 |
| 1 | Today Daily Change | -5.29 |
| 2 | Today Daily Change % | -0.27 |
| 3 | Today daily open | 1930.34 |
The pair is trading below its 20 Daily moving average @ 1925.31, below its 50 Daily moving average @ 1931.44 , below its 100 Daily moving average @ 1944.49 and above its 200 Daily moving average @ 1924.26
| Trends | Trends.1 | |
|---|---|---|
| 0 | Daily SMA20 | 1925.31 |
| 1 | Daily SMA50 | 1931.44 |
| 2 | Daily SMA100 | 1944.49 |
| 3 | Daily SMA200 | 1924.26 |
The previous day high was 1947.47 while the previous day low was 1927.99. The daily 38.2% Fib levels comes at 1935.43, expected to provide resistance. Similarly, the daily 61.8% fib level is at 1940.03, expected to provide resistance.
Note the levels of interest below:
- Pivot support is noted at 1923.06, 1915.79, 1903.58
- Pivot resistance is noted at 1942.54, 1954.75, 1962.02
| Levels | Levels.1 |
|---|---|
| Previous Daily High | 1947.47 |
| Previous Daily Low | 1927.99 |
| Previous Weekly High | 1930.77 |
| Previous Weekly Low | 1901.07 |
| Previous Monthly High | 1966.08 |
| Previous Monthly Low | 1884.85 |
| Daily Fibonacci 38.2% | 1935.43 |
| Daily Fibonacci 61.8% | 1940.03 |
| Daily Pivot Point S1 | 1923.06 |
| Daily Pivot Point S2 | 1915.79 |
| Daily Pivot Point S3 | 1903.58 |
| Daily Pivot Point R1 | 1942.54 |
| Daily Pivot Point R2 | 1954.75 |
| Daily Pivot Point R3 | 1962.02 |
[/s2If]
Download Nehcap EAWe have two EAs that are operational on our LIVE accounts.
- EA-FIX: Check out the details here. Download EA-FIX . EA-FIX is a non-grid HFT scalper.
- EA-GROWTH: High quality low dd EA using trend grids. Download EA_GROWTHJoin Our Telegram Group


