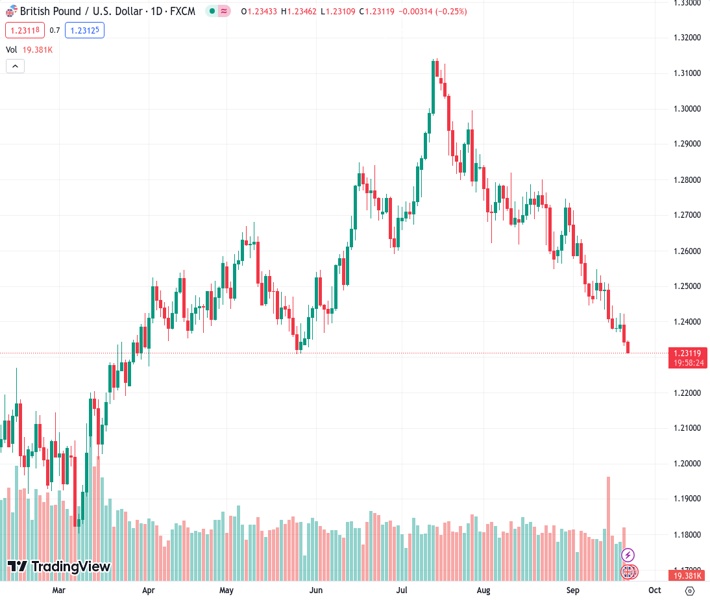
The GBPUSD exchange rate declines for the second consecutive day and reaches a new low that hasn’t been seen in several months.
…
This is a premium post.
[s2If !current_user_can(access_s2member_level4)]Please register for FREE REGISTER to read full post below containing analysis. In case of any error or you think you are not able to read the full post below, please email us at support#nehcap.com [lwa][/s2If] [s2If current_user_can(access_s2member_level1)]
- GBP/USD drifts lower for the second straight day and touches a fresh multi-month low.
The pair currently trades last at 1.23137.
The previous day high was 1.2421 while the previous day low was 1.2332. The daily 38.2% Fib levels comes at 1.2366, expected to provide resistance. Similarly, the daily 61.8% fib level is at 1.2387, expected to provide resistance.
The GBP/USD pair remains under some selling pressure for the second successive day on Thursday and drops closer to the 1.2300 round figure, or a fresh low since early June during the Asian session.
The US Dollar (USD) manages to preserve the previous day’s post-FOMC recovery gains from over a one-week low and remains well within the striking distance of a six-month high, which, in turn, is seen exerting pressure on the GBP/USD pair. As was widely anticipated, the Federal Reserve (Fed) decided to leave interest rates unchanged, though maintained its forecast for rates to peak at 5.5% to 5.75% this year, keeping the door open for one more 25 bps lift-off in 2023. Moreover, policymakers now see the benchmark rate at 5.1% next year, suggesting just two rate cuts in 2024 as compared to four rate cuts projected previously.
The higher-for-longer narrative keeps the US Treasury bond yields elevated, which, along with a softer risk tone, continues to underpin the safe-haven Greenback. In fact, the yield on the two-year US government bond shot to a 17-year and the benchmark 10-year Treasury note touched its highest since late 2007. This, in turn, fuels worries about economic headwinds stemming from rapidly rising borrowing costs and tempers investors’ appetite for riskier assets. Apart from this, expectations for an imminent pause in the Bank of England’s (BoE) rate-hiking cycle continue to weigh on the British Pound and drag the GBP/USD pair.
Market pricing swung drastically after data released from the UK on Wednesday showed that the annual headline CPI fell to 6.7% in August from 6.8% in July, defying consensus forecast for a rise to 7%. Moreover, importantly the core CPI – excluding volatile food, energy, alcohol and tobacco prices – came in at 6.2% in the 12 months to the end of August, down from 6.9% in July. This comes on top of reviving recession fears and signs that the UK labour market is cooling, reaffirming market expectations. Hence, the focus will remain glued to the highly-anticipated BoE policy decision, scheduled to be announced later this Thursday.
Later during the early North American session, traders will take cues from the US economic docket – featuring the usual Initial Weekly Jobless Claims, Philly Fed Manufacturing Index and Existing Home Sales data. This, along with the US bond yields and the broader risk sentiment, might influence the USD price dynamics and provide some impetus to the GBP/USD pair. Nevertheless, the aforementioned fundamental backdrop seems tilted in favour of bearish traders and suggests that the path of least resistance for spot prices remains to the downside. Hence, any attempted recovery might get sold into and is more likely to remain capped.
Technical Levels: Supports and Resistances
GBPUSD currently trading at 1.232 at the time of writing. Pair opened at 1.2344 and is trading with a change of -0.19 % .
| Overview | Overview.1 | |
|---|---|---|
| 0 | Today last price | 1.2320 |
| 1 | Today Daily Change | -0.0024 |
| 2 | Today Daily Change % | -0.1900 |
| 3 | Today daily open | 1.2344 |
The pair remains strongly bearish on the daily time frame. It trades below the 20 SMA @ 1.2523, 50 SMA 1.27, 100 SMA @ 1.2649 and 200 SMA @ 1.2433.
| Trends | Trends.1 | |
|---|---|---|
| 0 | Daily SMA20 | 1.2523 |
| 1 | Daily SMA50 | 1.2700 |
| 2 | Daily SMA100 | 1.2649 |
| 3 | Daily SMA200 | 1.2433 |
The previous day high was 1.2421 while the previous day low was 1.2332. The daily 38.2% Fib levels comes at 1.2366, expected to provide resistance. Similarly, the daily 61.8% fib level is at 1.2387, expected to provide resistance.
Note the levels of interest below:
- Pivot support is noted at 1.231, 1.2277, 1.2221
- Pivot resistance is noted at 1.24, 1.2455, 1.2489
| Levels | Levels.1 |
|---|---|
| Previous Daily High | 1.2421 |
| Previous Daily Low | 1.2332 |
| Previous Weekly High | 1.2548 |
| Previous Weekly Low | 1.2379 |
| Previous Monthly High | 1.2841 |
| Previous Monthly Low | 1.2548 |
| Daily Fibonacci 38.2% | 1.2366 |
| Daily Fibonacci 61.8% | 1.2387 |
| Daily Pivot Point S1 | 1.2310 |
| Daily Pivot Point S2 | 1.2277 |
| Daily Pivot Point S3 | 1.2221 |
| Daily Pivot Point R1 | 1.2400 |
| Daily Pivot Point R2 | 1.2455 |
| Daily Pivot Point R3 | 1.2489 |
[/s2If]
Download Nehcap EAWe have two EAs that are operational on our LIVE accounts.
- EA-FIX: Check out the details here. Download EA-FIX . EA-FIX is a non-grid HFT scalper.
- EA-GROWTH: High quality low dd EA using trend grids. Download EA_GROWTHJoin Our Telegram Group


