The EURJPY pair, currently at 157.985, has decreased by 0.06% to 157.94. It has been unable to maintain its progress above the 158.00 mark following the Federal Reserve’s announcement, which had a more aggressive tone.
…
This is a premium post.
[s2If !current_user_can(access_s2member_level4)]Please register for FREE REGISTER to read full post below containing analysis. In case of any error or you think you are not able to read the full post below, please email us at support#nehcap.com [lwa][/s2If] [s2If current_user_can(access_s2member_level1)]
- EUR/JPY trades down 0.06% at 157.94, failing to sustain gains above the 158.00 level after the Fed’s hawkish announcement.
The pair currently trades last at 157.985.
The previous day high was 158.28 while the previous day low was 157.58. The daily 38.2% Fib levels comes at 158.01, expected to provide resistance. Similarly, the daily 61.8% fib level is at 157.85, expected to provide support.
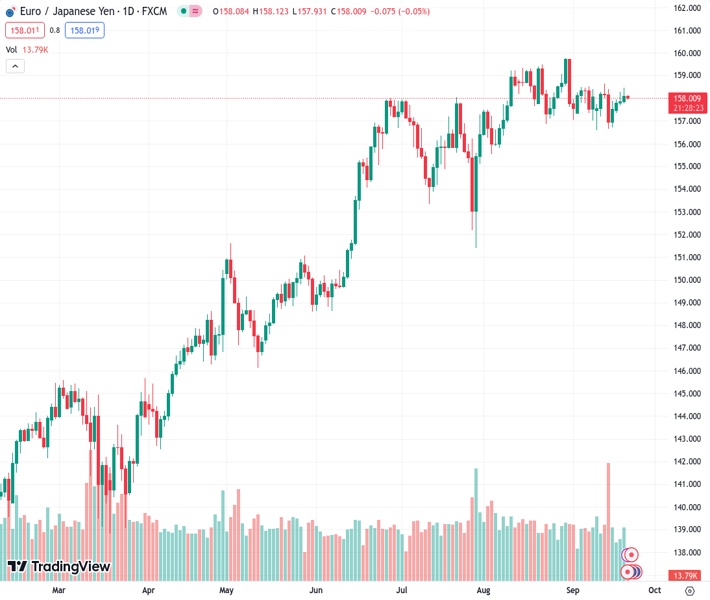
The EUR/JPY hovers below the 158.00 area after clinging to slim gains on Wednesday. The Federal Reserve’s decision to hold rates while upward revising its estimates on interest rates for the next year is a headwind for the Euro (EUR) as Thursday’s Asian session begins. At the time of writing, the cross exchanges hands at 157.94, down 0.06%.
The daily chart portrays the pair is trading sideways, though it printed a new weekly high of 158.45, but failure to cling to 158.00 opened the door for a pullback. In that event, the EUR/JPY first support would be the Senkou Span A at 157.89, followed by the Tenkan-Sen at 157.61. Further downside is expected at the top of the Ichimoku Cloud (Kumo) at 156.50.
Conversely, if EUR/JPY reconquers the 158.00 mark, the next resistance would be the September 20 high at 158.45. A breach of the latter will expose the 159.00 mark, followed by the year-to-date (YTD) high at 159.76.
Technical Levels: Supports and Resistances
EURJPY currently trading at 157.98 at the time of writing. Pair opened at 157.9 and is trading with a change of 0.05 % .
| Overview | Overview.1 | |
|---|---|---|
| 0 | Today last price | 157.98 |
| 1 | Today Daily Change | 0.08 |
| 2 | Today Daily Change % | 0.05 |
| 3 | Today daily open | 157.90 |
The pair is trading below its 20 Daily moving average @ 158.01, above its 50 Daily moving average @ 157.33 , above its 100 Daily moving average @ 154.64 and above its 200 Daily moving average @ 148.88
| Trends | Trends.1 | |
|---|---|---|
| 0 | Daily SMA20 | 158.01 |
| 1 | Daily SMA50 | 157.33 |
| 2 | Daily SMA100 | 154.64 |
| 3 | Daily SMA200 | 148.88 |
The previous day high was 158.28 while the previous day low was 157.58. The daily 38.2% Fib levels comes at 158.01, expected to provide resistance. Similarly, the daily 61.8% fib level is at 157.85, expected to provide support.
Note the levels of interest below:
- Pivot support is noted at 157.56, 157.23, 156.87
- Pivot resistance is noted at 158.26, 158.61, 158.95
| Levels | Levels.1 |
|---|---|
| Previous Daily High | 158.28 |
| Previous Daily Low | 157.58 |
| Previous Weekly High | 158.66 |
| Previous Weekly Low | 156.58 |
| Previous Monthly High | 159.76 |
| Previous Monthly Low | 155.53 |
| Daily Fibonacci 38.2% | 158.01 |
| Daily Fibonacci 61.8% | 157.85 |
| Daily Pivot Point S1 | 157.56 |
| Daily Pivot Point S2 | 157.23 |
| Daily Pivot Point S3 | 156.87 |
| Daily Pivot Point R1 | 158.26 |
| Daily Pivot Point R2 | 158.61 |
| Daily Pivot Point R3 | 158.95 |
[/s2If]
Download Nehcap EAWe have two EAs that are operational on our LIVE accounts.
- EA-FIX: Check out the details here. Download EA-FIX . EA-FIX is a non-grid HFT scalper.
- EA-GROWTH: High quality low dd EA using trend grids. Download EA_GROWTHJoin Our Telegram Group


