The price of silver, represented by #XAGUSD, remained below the 200-day moving average of $23.46, despite the Federal Reserve’s hawkish position on monetary policy.
…
This is a premium post.
[s2If !current_user_can(access_s2member_level4)]Please register for FREE REGISTER to read full post below containing analysis. In case of any error or you think you are not able to read the full post below, please email us at support#nehcap.com [lwa][/s2If] [s2If current_user_can(access_s2member_level1)]
- Silver price was unable to break the 200-day moving average of $23.46 after the Fed’s hawkish stance.
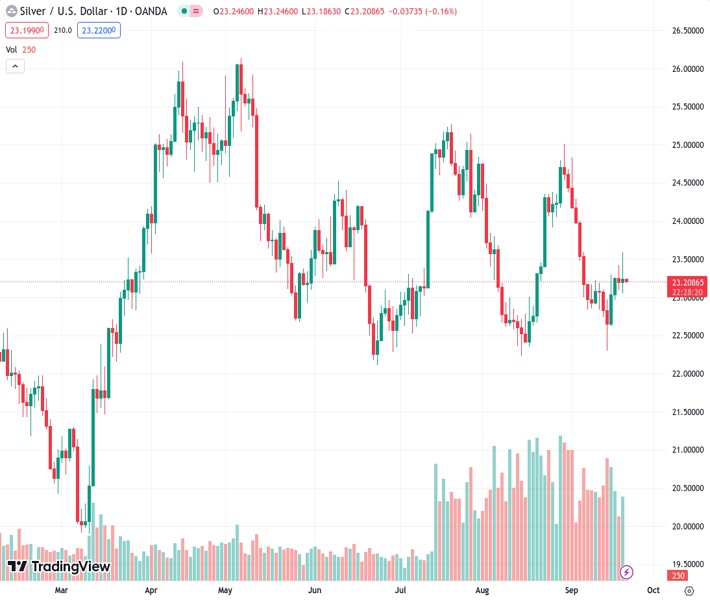
The pair currently trades last at 23.207.
The previous day high was 23.42 while the previous day low was 23.1. The daily 38.2% Fib levels comes at 23.22, expected to provide resistance. Similarly, the daily 61.8% fib level is at 23.3, expected to provide resistance.
Silver price clings to its earlier gains, though it failed to sustain a break above the 200-day moving average (DMA) of $23.46 after the US Federal Reserve delivered a hawkish pause. Consequently, the Greenback (USD) advanced, underpinned by the US Treasury bond yields advancement to multi-year highs. The XAG/USD is trading at $23.24, a gain of 0.24%.
XAG/USD extended its losses after the Fed held rates unchanged at the 5.25%-5.50% range. Officials stressed that “Inflation remains elevated” while acknowledging the economy is expanding “at a solid pace” while the labor market remains tight. Nevertheless, market participants reacted to the Summary of Economic Projections (SEP), which showed upward revisions to the Federal Funds Rate (FFR).
The SEP showed Fed policymakers eyeing rates to finish at 5.6% in 2023 and 5.1% in 2024, above June’s 4.6% projection. In regards to additional economic data, the Gross Domestic Product (GDP)) was also upward resided from 1% to 2.1%. The unemployment rate is expected to dip to 3.8% from 4.1%, PCE stood at 3.3%, up from 3.2%, while core PCE is foreseen to fall from 3.9% to 3.7%.
In his press conference, the Fed Chair Jerome Powell said the US central bank is “prepared to raise rates further, if appropriate.” He added the Fed’s intention to keep policy at a restrictive level until they’re confident that inflation is moving towards the Fed’s2% objective.
Consequently, US treasury bold yields climbed, with US 2s and 5s reaching 5.152% and 4.547% each. That underpinned the Greenback, as shown in the US Dollar Index (DXY), a gauge of the buck’s performance against its peers, closing at 10.33 for 0.12% gains.
In the meantime, US real yields pushed higher, as seen by the US 10-year Treasury Inflation-Protected Securities (TIPS) bond yield, which broke the 2% barrier and finished at 2.046%, a headwind for precious metals.
Hence, if US real yields continue to climb, investors could expect further downside in the segment. Therefore, XAG/USD traders must track them to gauge the future direction of Silver prices.
After failing to achieve a daily close above the 200-DMA successfully, the XAG/USD is exposed to sellers, as drafted by the daily chart. On Wednesday’s session, the white metal printed a daily high at $23.58, shy of the 50-DMA at $23.70, opening the door for a pullback, which occurred using the Fed’s decision as a catalyst. Therefore, the XAG/USD most likely scenario would push prices below the $23.00 mark, followed by the September 14 daily low of $22.30. On the other hand, upside risks remain at the September 20 daily high of $23.58.
Technical Levels: Supports and Resistances
XAGUSD currently trading at 23.2 at the time of writing. Pair opened at 23.2 and is trading with a change of 0.0 % .
| Overview | Overview.1 | |
|---|---|---|
| 0 | Today last price | 23.2 |
| 1 | Today Daily Change | 0.0 |
| 2 | Today Daily Change % | 0.0 |
| 3 | Today daily open | 23.2 |
The pair remains strongly bearish on the daily time frame. It trades below the 20 SMA @ 23.63, 50 SMA 23.74, 100 SMA @ 23.7 and 200 SMA @ 23.48.
| Trends | Trends.1 | |
|---|---|---|
| 0 | Daily SMA20 | 23.63 |
| 1 | Daily SMA50 | 23.74 |
| 2 | Daily SMA100 | 23.70 |
| 3 | Daily SMA200 | 23.48 |
The previous day high was 23.42 while the previous day low was 23.1. The daily 38.2% Fib levels comes at 23.22, expected to provide resistance. Similarly, the daily 61.8% fib level is at 23.3, expected to provide resistance.
Note the levels of interest below:
- Pivot support is noted at 23.06, 22.92, 22.73
- Pivot resistance is noted at 23.38, 23.56, 23.71
| Levels | Levels.1 |
|---|---|
| Previous Daily High | 23.42 |
| Previous Daily Low | 23.10 |
| Previous Weekly High | 23.29 |
| Previous Weekly Low | 22.30 |
| Previous Monthly High | 25.02 |
| Previous Monthly Low | 22.23 |
| Daily Fibonacci 38.2% | 23.22 |
| Daily Fibonacci 61.8% | 23.30 |
| Daily Pivot Point S1 | 23.06 |
| Daily Pivot Point S2 | 22.92 |
| Daily Pivot Point S3 | 22.73 |
| Daily Pivot Point R1 | 23.38 |
| Daily Pivot Point R2 | 23.56 |
| Daily Pivot Point R3 | 23.71 |
[/s2If]
Download Nehcap EAWe have two EAs that are operational on our LIVE accounts.
- EA-FIX: Check out the details here. Download EA-FIX . EA-FIX is a non-grid HFT scalper.
- EA-GROWTH: High quality low dd EA using trend grids. Download EA_GROWTHJoin Our Telegram Group


