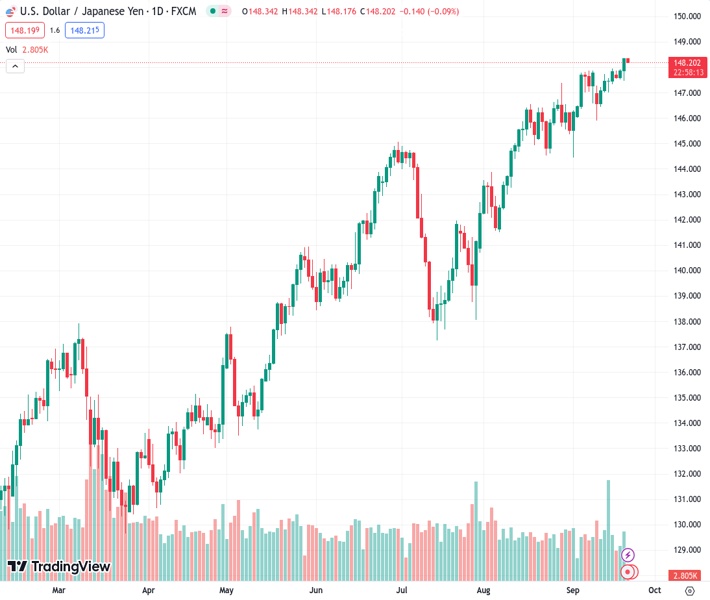
The USDJPY currency pair, which was at a rate of 148.198, ended the day on Wednesday at 148.34, showing a 0.33% increase.
…
This is a premium post.
[s2If !current_user_can(access_s2member_level4)]Please register for FREE REGISTER to read full post below containing analysis. In case of any error or you think you are not able to read the full post below, please email us at support#nehcap.com [lwa][/s2If] [s2If current_user_can(access_s2member_level1)]
- USD/JPY closed Wednesday at 148.34, up by 0.33%.
The pair currently trades last at 148.198.
The previous day high was 147.92 while the previous day low was 147.51. The daily 38.2% Fib levels comes at 147.76, expected to provide support. Similarly, the daily 61.8% fib level is at 147.67, expected to provide support.
On Wednesday, the USD/JPY closed with gains above 148.00 as the USD got a boost amid the hawkish Federal Reserve (Fed) stance, which fueled US yields to multi-year highs.
As expected, the US Federal Reserve kept interest rates unchanged at 5.25%-5.50%. Still, it surprised the market with its projections to keep rates at 5.1% for 2024 (revised from 4.6%), and virtually sent a message that it will keep rates at restrictive levels for a longer time. In addition, the projections for rates in 2023, via the so-called dot plots, were kept at 5.6% and signalled one last like in the remainder of the year, and markets are placing bets for it to be in December.
As a reaction, the short-term US yields rose to multi-year highs, with the 2,5 and 10-year rates advancing to 5.17%, 4.57% and 4.40%, respectively, making the US Dollar gain interest.
On the JPY’s side, eyes are on Friday’s Bank of Japan (BoJ) meeting decision. The bank has already stated that changes to monetary policy won’t be considered until local wage and inflation indicators match their projections. However, markets will look for any clues to start discounting a potential lift-off in the near term. In the meantime, as the Fed’s tightening cycle isn’t over yet, divergences between the two banks will continue weakening the Yen unless the BoJ leaves its ultra-dovish stance.
Based on the daily chart analysis, a bullish outlook is noted for USD/JPY in the near term. The Relative Strength Index (RSI) stands above its midline in positive territory, further validated by the decreasing red bars on the Moving Average Convergence Divergence (MACD). In addition, the pair is above the 20,100,200-day Simple Moving Average (SMA), indicating that the bulls are in command of the broader picture.
Support levels: 147.80, 147.10 (20-day SMA), 146.00.
Resistance levels: 148.50, 149.00, 150.00.
Technical Levels: Supports and Resistances
USDJPY currently trading at 148.21 at the time of writing. Pair opened at 147.86 and is trading with a change of 0.24 % .
| Overview | Overview.1 | |
|---|---|---|
| 0 | Today last price | 148.21 |
| 1 | Today Daily Change | 0.35 |
| 2 | Today Daily Change % | 0.24 |
| 3 | Today daily open | 147.86 |
The pair remains strongly bullish on the daily timeframe. It trades above its 20 SMA @ 146.82, 50 SMA 144.15, 100 SMA @ 142.03 and 200 SMA @ 137.46.
| Trends | Trends.1 | |
|---|---|---|
| 0 | Daily SMA20 | 146.82 |
| 1 | Daily SMA50 | 144.15 |
| 2 | Daily SMA100 | 142.03 |
| 3 | Daily SMA200 | 137.46 |
The previous day high was 147.92 while the previous day low was 147.51. The daily 38.2% Fib levels comes at 147.76, expected to provide support. Similarly, the daily 61.8% fib level is at 147.67, expected to provide support.
Note the levels of interest below:
- Pivot support is noted at 147.61, 147.35, 147.19
- Pivot resistance is noted at 148.02, 148.18, 148.43
| Levels | Levels.1 |
|---|---|
| Previous Daily High | 147.92 |
| Previous Daily Low | 147.51 |
| Previous Weekly High | 147.95 |
| Previous Weekly Low | 145.90 |
| Previous Monthly High | 147.38 |
| Previous Monthly Low | 141.51 |
| Daily Fibonacci 38.2% | 147.76 |
| Daily Fibonacci 61.8% | 147.67 |
| Daily Pivot Point S1 | 147.61 |
| Daily Pivot Point S2 | 147.35 |
| Daily Pivot Point S3 | 147.19 |
| Daily Pivot Point R1 | 148.02 |
| Daily Pivot Point R2 | 148.18 |
| Daily Pivot Point R3 | 148.43 |
[/s2If]
Download Nehcap EAWe have two EAs that are operational on our LIVE accounts.
- EA-FIX: Check out the details here. Download EA-FIX . EA-FIX is a non-grid HFT scalper.
- EA-GROWTH: High quality low dd EA using trend grids. Download EA_GROWTHJoin Our Telegram Group


