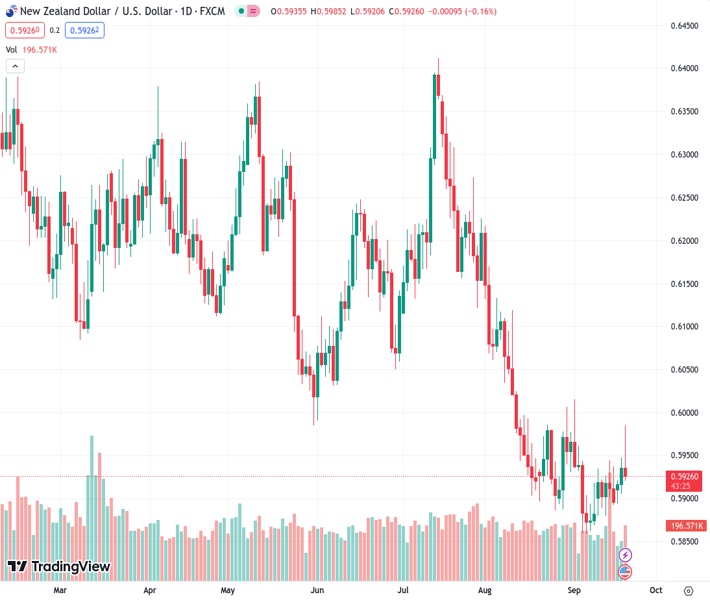
The NZDUSD exchange rate at 0.59233 experienced a change in direction and dropped to around 0.5930, following its previous peak at 0.5985.
…
This is a premium post.
[s2If !current_user_can(access_s2member_level4)]Please register for FREE REGISTER to read full post below containing analysis. In case of any error or you think you are not able to read the full post below, please email us at support#nehcap.com [lwa][/s2If] [s2If current_user_can(access_s2member_level1)]
- The NZD/USD reversed its course and fell towards 0.5930, after reaching a high of 0.5985.
The pair currently trades last at 0.59233.
The previous day high was 0.5948 while the previous day low was 0.5904. The daily 38.2% Fib levels comes at 0.5931, expected to provide resistance. Similarly, the daily 61.8% fib level is at 0.5921, expected to provide support.
In Tuesday’s session, the NZD/USD saw volatility trading in the 0.5924 – 0.5985 and clearing all of its daily gains. The US Dollar recovered as the Federal Reserve (Fed) hinted at one more hike and pushed back rate cuts in 2024.
The US Federal Reserve, as expected, didn’t hike interest rates but surprised with a somewhat more hawkish stance, causing the market to fly to safety. They hinted at a single rate hike of 25 basis points later this year as the Summary of Economic Projection’s (SEM) so-called dot plots median rate remained at 5.6% and reduced future rate cut projections for 2024 from 100 to 50 basis points. This shift led markets to anticipate a rate cut not before September 2024.
During the press conference, Chair Powell emphasised their priority is a smooth economic transition and mentioned the importance of price stability. He then added that the decisions will be decided meeting by meeting, relying solely on incoming data. However, he did not hesitate to comment that the Fed is prepared to hike rates further if necessary.
After the press conference, the short-term US yields stand at multi-year highs, with the 2,5 and 10-year rates rising to 5.15%, 4.55% and 4.36%, their highest in more than 10-year, which seems to make the USD gain interest. In line with that, the DXY index rose back above 105.00 and cleared daily losses.
Despite the drop, the technical analysis of the daily chart suggests a neutral to bullish stance for NZD/USD as the bulls work on recovering their ground. Having turned flat in negative territory, the Relative Strength Index (RSI) suggests a potential market equilibrium with balanced selling and buying pressure,while the Moving Average Convergence (MACD) histogram presents larger green bars. In addition, the pair is above the 20-day Simple Moving Average (SMA), but below the 100 and 200-day SMAs, indicating that the bulls aren’t done yet and that the outlook is still positive for the short term.
Support levels: 0.5920 (20-day SMA), 0.5890, 0.5860.
Resistance levels: 0.6000,0.6030, 0.6050.
Technical Levels: Supports and Resistances
NZDUSD currently trading at 0.5926 at the time of writing. Pair opened at 0.5936 and is trading with a change of -0.17 % .
| Overview | Overview.1 | |
|---|---|---|
| 0 | Today last price | 0.5926 |
| 1 | Today Daily Change | -0.0010 |
| 2 | Today Daily Change % | -0.1700 |
| 3 | Today daily open | 0.5936 |
The pair is trading above its 20 Daily moving average @ 0.5921, below its 50 Daily moving average @ 0.6043 , below its 100 Daily moving average @ 0.6106 and below its 200 Daily moving average @ 0.6195
| Trends | Trends.1 | |
|---|---|---|
| 0 | Daily SMA20 | 0.5921 |
| 1 | Daily SMA50 | 0.6043 |
| 2 | Daily SMA100 | 0.6106 |
| 3 | Daily SMA200 | 0.6195 |
The previous day high was 0.5948 while the previous day low was 0.5904. The daily 38.2% Fib levels comes at 0.5931, expected to provide resistance. Similarly, the daily 61.8% fib level is at 0.5921, expected to provide support.
Note the levels of interest below:
- Pivot support is noted at 0.5911, 0.5886, 0.5868
- Pivot resistance is noted at 0.5955, 0.5973, 0.5998
| Levels | Levels.1 |
|---|---|
| Previous Daily High | 0.5948 |
| Previous Daily Low | 0.5904 |
| Previous Weekly High | 0.5945 |
| Previous Weekly Low | 0.5880 |
| Previous Monthly High | 0.6219 |
| Previous Monthly Low | 0.5885 |
| Daily Fibonacci 38.2% | 0.5931 |
| Daily Fibonacci 61.8% | 0.5921 |
| Daily Pivot Point S1 | 0.5911 |
| Daily Pivot Point S2 | 0.5886 |
| Daily Pivot Point S3 | 0.5868 |
| Daily Pivot Point R1 | 0.5955 |
| Daily Pivot Point R2 | 0.5973 |
| Daily Pivot Point R3 | 0.5998 |
[/s2If]
Download Nehcap EAWe have two EAs that are operational on our LIVE accounts.
- EA-FIX: Check out the details here. Download EA-FIX . EA-FIX is a non-grid HFT scalper.
- EA-GROWTH: High quality low dd EA using trend grids. Download EA_GROWTHJoin Our Telegram Group


