Gold’s price fluctuates and reaches $1,940.00 due to the Federal Reserve’s response, but ultimately declines following the Federal Reserve’s interest rate announcement.
…
This is a premium post.
[s2If !current_user_can(access_s2member_level4)]Please register for FREE REGISTER to read full post below containing analysis. In case of any error or you think you are not able to read the full post below, please email us at support#nehcap.com [lwa][/s2If] [s2If current_user_can(access_s2member_level1)]
- Gold takes a rocky path to $1,940.00 on Fed reaction, decides to walk down on Fed rate call.
The pair currently trades last at 1939.08.
The previous day high was 1937.44 while the previous day low was 1929.79. The daily 38.2% Fib levels comes at 1932.71, expected to provide support. Similarly, the daily 61.8% fib level is at 1934.52, expected to provide support.
The XAU/USD slipped to $1,940.00 after the Federal Reserve (Fed) held benchmark interest rates at 5.5% for the time being. The Federal Open Market Committee (FOMC) released their inflation expectations looking forward, seeing inflation a little bit higher than it previously forecast.
Fed Chair Jerome Powell took the podium to outline the Fed’s position in a speech shortly after the rate call, and his overall tone kept Gold prices bolted to their initial reaction levels.
Read More:
Jerome Powell speaks on policy outlook following the decision to hold interest rate steady
Fed dot plot points to one more 25 bps hike in 2023 and 50 bps cut in 2024
According to the Fed’s ‘dot plot’, the Summary of Projections (SEP), the US central bank is still on pace to deliver one last 25-basis-point hike in 2023. The median of Fed officials sees the official Fed funds rate at 5.1% by the end of 2024.
Fed Chair Jerome Powell reiterated the Fed’s dedication to achieving their long-term 2% inflation target. While Chair Powell noted that the Fed is very likely to be near the top of the rate hike cycle, but reaffirmed that the Fed will base its future decisions on data.
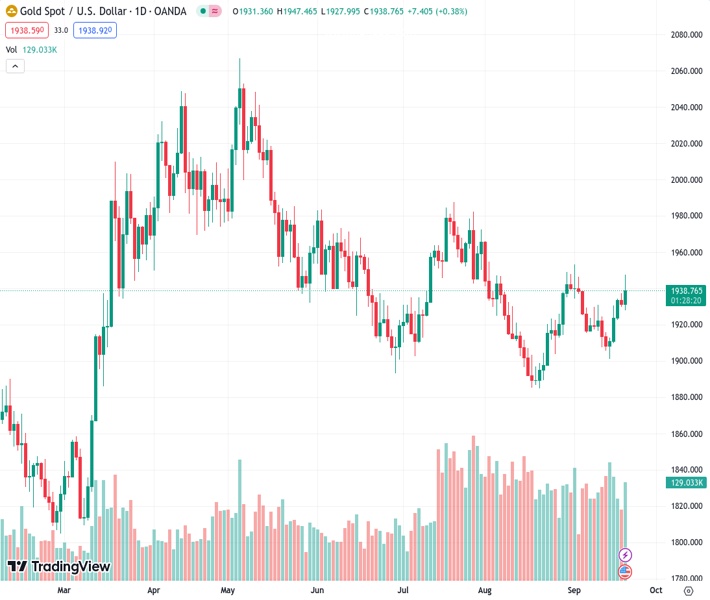
Gold prices initially ramped up during the pre-Fed Wednesday trading session, lifting from the day’s opening near $1,931.00, reaching a peak of $1,947.00, just beneath the $1,950.00 critical level.
The XAU/USD swamped out following the Fed, declining to the $1,940.00 level before staging a profit-taking rally that ultimately failed to recover the day’s high, and Gold is set to decline further from $1,940.00 if buyers remain on the sidelines.
On daily candlesticks, Gold saw a clear rejection from the 100-day Simple Moving Average (SMA), and current price action is seeing support from the 200-day SMA currently floating up to $1,925.00.
Technical Levels: Supports and Resistances
XAUUSD currently trading at 1940.48 at the time of writing. Pair opened at 1931.38 and is trading with a change of 0.47 % .
| Overview | Overview.1 | |
|---|---|---|
| 0 | Today last price | 1940.48 |
| 1 | Today Daily Change | 9.10 |
| 2 | Today Daily Change % | 0.47 |
| 3 | Today daily open | 1931.38 |
The pair is trading above its 20 Daily moving average @ 1924.58, above its 50 Daily moving average @ 1931.99 , below its 100 Daily moving average @ 1945.57 and above its 200 Daily moving average @ 1923.66
| Trends | Trends.1 | |
|---|---|---|
| 0 | Daily SMA20 | 1924.58 |
| 1 | Daily SMA50 | 1931.99 |
| 2 | Daily SMA100 | 1945.57 |
| 3 | Daily SMA200 | 1923.66 |
The previous day high was 1937.44 while the previous day low was 1929.79. The daily 38.2% Fib levels comes at 1932.71, expected to provide support. Similarly, the daily 61.8% fib level is at 1934.52, expected to provide support.
Note the levels of interest below:
- Pivot support is noted at 1928.3, 1925.22, 1920.65
- Pivot resistance is noted at 1935.95, 1940.52, 1943.6
| Levels | Levels.1 |
|---|---|
| Previous Daily High | 1937.44 |
| Previous Daily Low | 1929.79 |
| Previous Weekly High | 1930.77 |
| Previous Weekly Low | 1901.07 |
| Previous Monthly High | 1966.08 |
| Previous Monthly Low | 1884.85 |
| Daily Fibonacci 38.2% | 1932.71 |
| Daily Fibonacci 61.8% | 1934.52 |
| Daily Pivot Point S1 | 1928.30 |
| Daily Pivot Point S2 | 1925.22 |
| Daily Pivot Point S3 | 1920.65 |
| Daily Pivot Point R1 | 1935.95 |
| Daily Pivot Point R2 | 1940.52 |
| Daily Pivot Point R3 | 1943.60 |
[/s2If]
Download Nehcap EAWe have two EAs that are operational on our LIVE accounts.
- EA-FIX: Check out the details here. Download EA-FIX . EA-FIX is a non-grid HFT scalper.
- EA-GROWTH: High quality low dd EA using trend grids. Download EA_GROWTHJoin Our Telegram Group


