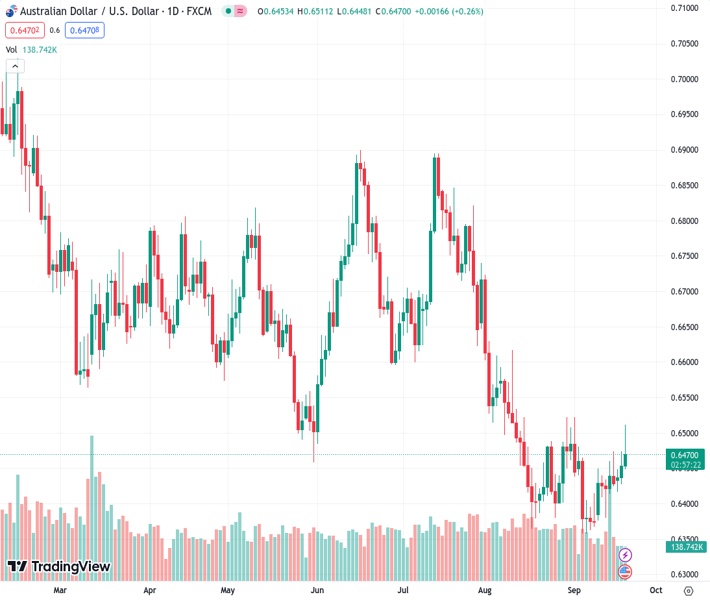
The AUDUSD pair, currently trading at 0.64785, experiences a significant increase to 0.6507, representing a rise of 0.83%. This surge is attributed to a decrease in US bond yields and a drop of 0.46% in the US Dollar Index, which now stands at 104.72.
…
This is a premium post.
[s2If !current_user_can(access_s2member_level4)]Please register for FREE REGISTER to read full post below containing analysis. In case of any error or you think you are not able to read the full post below, please email us at support#nehcap.com [lwa][/s2If] [s2If current_user_can(access_s2member_level1)]
- AUD/USD surges to 0.6507, up 0.83%, as US bond yields retreat and the US Dollar Index drops 0.46% to 104.72.”
The pair currently trades last at 0.64785.
The previous day high was 0.6474 while the previous day low was 0.6428. The daily 38.2% Fib levels comes at 0.6456, expected to provide support. Similarly, the daily 61.8% fib level is at 0.6445, expected to provide support.
The Australian Dollar (AUD) is climbing sharply against the US Dollar (USD) minutes ahead of the US Federal Reserve’s (Fed) monetary policy decision, as US bond yields edge lower after climbing to multi-year highs on Tuesday. Therefore, the AUD/USD is trading at 0.6507, after hitting a daily low of 0.6448, gains 0.83%.
The last hour has witnessed an increase in volatility as the Fed’s decision approaches. Wall Street trades mixed, the outlier being the Nasdaq Composite, down 0.08%. The Greenback (USD) remains under pressure, down 0.46%, as depicted by the US Dollar Index (DXY) at 104.72. The fixed income space shows US bond yields dropping while traders safety their seatbelts.
Market participant estimates see the Fed keeping rates unchanged but delivering a hawkish statement. Fed policymakers will update their economic projections, with speculations of growth to be upward revised and revised inflation down, with the only question being: where does the Fed see the Federal Funds Rate in 2023, 2024, and 2025?
The latest Fed’s Summary of Economic Projections (SEP) foresaw the FFR at 5.6% in 2023 and 4.6% in 2024. Any downward revisions for 2024 could weigh on the Greenback, and the AUD/USD could extend its gains for the rest of the day.
Money market futures show the Fed’s odds for a November rate hike are 27% for a quarter of a percent increase, ahead of the Federal Open Market Committee (FOMC) decision. For December, the odds stand at 34.1%.
On Australia’s front, the Aussie (AUD) remains underpinned by upbeat news from China. As recent Chinese data has improved, the People’s Bank of China (PBoC) kept the one and 5-year loan prime rates (LPR) unchanged.
Furthermore, the latest Reserve Bank of Australia (RBA) monetary policy minutes noted that members discussed weak domestic demand and contagion from China’s economic slowdown, which were seen as factors for weak economic growth. However, the RBA kept the door open for further tightening if inflation probes to be stickier than expected.
The AUD/USD is set to trade volatile amidst the Fed’s decision, delivered at 18:00 GMT. The decision would be followed by the Federal Reserve Chair Jerome Powell’s press conference, at around 18:30 GMT.
The daily chart portrays the pair as neutral-biased but threatening to turn neutral-upwards as the pair approaches the August 30 high of 0.6522. a breach of that level, and the AUD/USD could challenge the 50-day Moving Average (DMA) at 0.6540 before testing the next resistance area found at 0.6616, the August 10 high. Failure to extend its gains could pave the way for a pullback toward the September 15 swing high at 0.6474.
Technical Levels: Supports and Resistances
AUDUSD currently trading at 0.6502 at the time of writing. Pair opened at 0.6454 and is trading with a change of 0.74 % .
| Overview | Overview.1 | |
|---|---|---|
| 0 | Today last price | 0.6502 |
| 1 | Today Daily Change | 0.0048 |
| 2 | Today Daily Change % | 0.7400 |
| 3 | Today daily open | 0.6454 |
The pair is trading above its 20 Daily moving average @ 0.6432, below its 50 Daily moving average @ 0.6547 , below its 100 Daily moving average @ 0.6613 and below its 200 Daily moving average @ 0.6701
| Trends | Trends.1 | |
|---|---|---|
| 0 | Daily SMA20 | 0.6432 |
| 1 | Daily SMA50 | 0.6547 |
| 2 | Daily SMA100 | 0.6613 |
| 3 | Daily SMA200 | 0.6701 |
The previous day high was 0.6474 while the previous day low was 0.6428. The daily 38.2% Fib levels comes at 0.6456, expected to provide support. Similarly, the daily 61.8% fib level is at 0.6445, expected to provide support.
Note the levels of interest below:
- Pivot support is noted at 0.643, 0.6406, 0.6384
- Pivot resistance is noted at 0.6476, 0.6498, 0.6522
| Levels | Levels.1 |
|---|---|
| Previous Daily High | 0.6474 |
| Previous Daily Low | 0.6428 |
| Previous Weekly High | 0.6474 |
| Previous Weekly Low | 0.6378 |
| Previous Monthly High | 0.6724 |
| Previous Monthly Low | 0.6364 |
| Daily Fibonacci 38.2% | 0.6456 |
| Daily Fibonacci 61.8% | 0.6445 |
| Daily Pivot Point S1 | 0.6430 |
| Daily Pivot Point S2 | 0.6406 |
| Daily Pivot Point S3 | 0.6384 |
| Daily Pivot Point R1 | 0.6476 |
| Daily Pivot Point R2 | 0.6498 |
| Daily Pivot Point R3 | 0.6522 |
[/s2If]
Download Nehcap EAWe have two EAs that are operational on our LIVE accounts.
- EA-FIX: Check out the details here. Download EA-FIX . EA-FIX is a non-grid HFT scalper.
- EA-GROWTH: High quality low dd EA using trend grids. Download EA_GROWTHJoin Our Telegram Group


