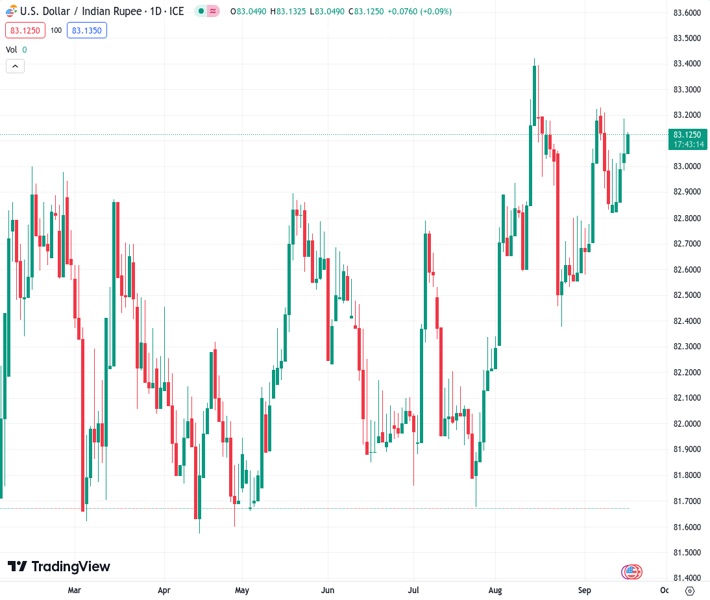
The Indian rupee, with an exchange rate of 83.1225 against the US dollar, experienced a boost in value because of the announcement of an increased trade deficit by India.
…
This is a premium post.
[s2If !current_user_can(access_s2member_level4)]Please register for FREE REGISTER to read full post below containing analysis. In case of any error or you think you are not able to read the full post below, please email us at support#nehcap.com [lwa][/s2If] [s2If current_user_can(access_s2member_level1)]
- USD/INR strengthened due to the release of a widened trade balance from India.
The pair currently trades last at 83.1225.
The previous day high was 83.2242 while the previous day low was 82.99. The daily 38.2% Fib levels comes at 83.1347, expected to provide resistance. Similarly, the daily 61.8% fib level is at 83.0794, expected to provide support.
USD/INR attempts to continue the winning streak that began on Tuesday, trading higher around 83.10 during the Asian session on Monday. The Indian Rupee (INR) is experiencing downward pressure due to the trade balance figure.
The report indicates that the trade deficit in India expanded to its highest level in 10 months, reaching $24.2 billion in August. This represents an increase from the trade deficit of $20.7 billion recorded in the previous month.
Additionally, the easing inflation in August is also putting pressure on the INR, which came in at 6.83%, compared to 7.44% in the previous month. Additionally, the Core inflation rate stood at 4.9%, aligning with market expectations.
Reserve Bank of India (RBI) Governor Shaktikanta Das has stated that the central bank anticipates inflation to ease starting from September onward. This suggests that the RBI expects a gradual decline in inflationary pressures, which can have implications for its monetary policy decisions.
Moreover, on Friday, Finance Minister Nirmala Sitharaman revealed that India is currently engaged in negotiations with approximately 22 countries to facilitate bilateral trade transactions in the Indian Rupee. This initiative suggests India’s efforts to strengthen trade ties and potentially reduce reliance on foreign currencies in international trade.
On the other hand, the US Dollar (USD) is facing downward pressure, likely a result of the downbeat consumer sentiment data from the United States (US) released on Friday. The preliminary US Michigan Consumer Sentiment Index registered a reading of 67.7, reflecting a decrease from the previous figure of 69.5. This reading also came in below the anticipated figure of 69.1 for the month of September.
The US Dollar Index (DXY), which assesses the performance of the US Dollar against six other major currencies, concluded its ninth week with an overall gain of 0.26%. Nevertheless, the spot price is hovering around 105.30.
The US Treasury yields have fully reversed their intraday gains, exerting downward pressure on the Greenback. The yield on the US 10-year bond has declined to 4.32%, down by 0.25% at the time of writing.
In the past week, significant economic data from the US has consistently highlighted robust economic conditions. These strong economic indicators provide additional support for the Fed’s intention to potentially implement another interest rate hike by the conclusion of 2023.
The Consumer Price Index (CPI), a key measure of inflation, exceeded expectations. Additionally, Retail Sales for the same month and Jobless Claims for the second week of September both yielded positive outcomes, signifying a positive economic outlook for the US.
Market participants will closely watch the Fed’s interest rate decisions scheduled for Wednesday. The Fed is expected to maintain its current interest rates without changes. Furthermore, market participants will carefully scrutinize the central bank’s communications, seeking any clues or insights regarding the possible future direction of interest rates.
Technical Levels: Supports and Resistances
USDINR currently trading at 83.0942 at the time of writing. Pair opened at 83.1004 and is trading with a change of -0.01 % .
| Overview | Overview.1 | |
|---|---|---|
| 0 | Today last price | 83.0942 |
| 1 | Today Daily Change | -0.0062 |
| 2 | Today Daily Change % | -0.0100 |
| 3 | Today daily open | 83.1004 |
The pair remains strongly bullish on the daily timeframe. It trades above its 20 SMA @ 82.8964, 50 SMA 82.6685, 100 SMA @ 82.4632 and 200 SMA @ 82.3479.
| Trends | Trends.1 | |
|---|---|---|
| 0 | Daily SMA20 | 82.8964 |
| 1 | Daily SMA50 | 82.6685 |
| 2 | Daily SMA100 | 82.4632 |
| 3 | Daily SMA200 | 82.3479 |
The previous day high was 83.2242 while the previous day low was 82.99. The daily 38.2% Fib levels comes at 83.1347, expected to provide resistance. Similarly, the daily 61.8% fib level is at 83.0794, expected to provide support.
Note the levels of interest below:
- Pivot support is noted at 82.9855, 82.8707, 82.7514
- Pivot resistance is noted at 83.2197, 83.339, 83.4538
| Levels | Levels.1 |
|---|---|
| Previous Daily High | 83.2242 |
| Previous Daily Low | 82.9900 |
| Previous Weekly High | 83.2896 |
| Previous Weekly Low | 82.5035 |
| Previous Monthly High | 83.5505 |
| Previous Monthly Low | 82.2240 |
| Daily Fibonacci 38.2% | 83.1347 |
| Daily Fibonacci 61.8% | 83.0794 |
| Daily Pivot Point S1 | 82.9855 |
| Daily Pivot Point S2 | 82.8707 |
| Daily Pivot Point S3 | 82.7514 |
| Daily Pivot Point R1 | 83.2197 |
| Daily Pivot Point R2 | 83.3390 |
| Daily Pivot Point R3 | 83.4538 |
[/s2If]
Download Nehcap EAWe have two EAs that are operational on our LIVE accounts.
- EA-FIX: Check out the details here. Download EA-FIX . EA-FIX is a non-grid HFT scalper.
- EA-GROWTH: High quality low dd EA using trend grids. Download EA_GROWTHJoin Our Telegram Group


