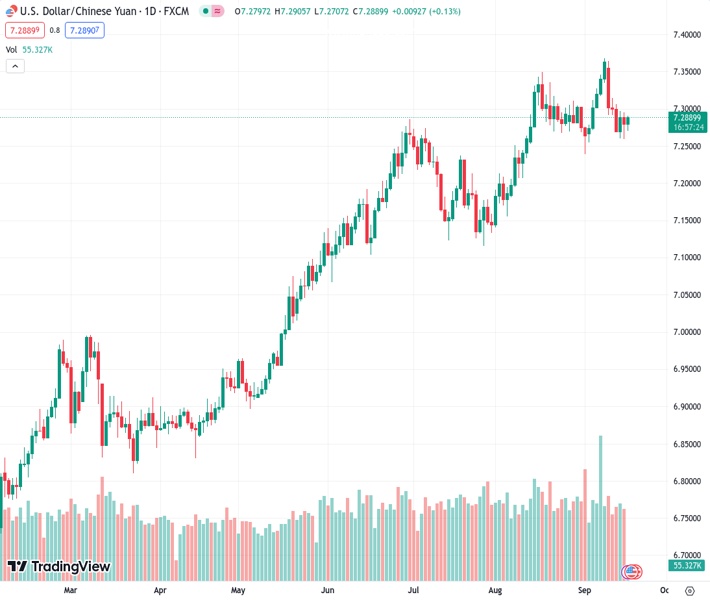
On Monday, the USDCNH pair slightly increases to 7.28879, moving closer to a resistance level that has been in place for several days.
…
This is a premium post.
[s2If !current_user_can(access_s2member_level4)]Please register for FREE REGISTER to read full post below containing analysis. In case of any error or you think you are not able to read the full post below, please email us at support#nehcap.com [lwa][/s2If] [s2If current_user_can(access_s2member_level1)]
- USD/CNH edges higher on Monday and climbs closer to a multi-day-old trading range hurdle.
The pair currently trades last at 7.28879.
The previous day high was 7.2952 while the previous day low was 7.2596. The daily 38.2% Fib levels comes at 7.2732, expected to provide support. Similarly, the daily 61.8% fib level is at 7.2817, expected to provide support.
The USD/CNH pair builds on Friday’s modest rebound from the 7.2595 region, or a nearly two-week low and gains some positive traction during the Asian session on Monday. Spot prices currently trade around the 7.2905 area, up over 0.10% for the day, flirting with the top boundary of a three-day-old range.
Looking at the broader picture, the USD/CNH pair is holding comfortably above technically significant 50-day, 100-day and 200-day Simple Moving Averages (SMAs), which, in turn, favours bullish traders. That said, oscillators on the daily chart are yet to confirm a bullish bias and warrant some caution before positioning for any meaningful appreciating move. Hence, any subsequent strength is more likely to confront a stiff barrier near the 7.3040-7.3050 region.
This is closely followed by resistance near the 7.3105 area, which if cleared should lift the USD/CNH pair towards the next relevant hurdle near the 7.3360-7.3365 region en route to the 7.3495 zone. Some follow-through buying beyond the 7.3500 mark should allow spot prices to challenge a multi-year peak, around the 7.3680-7.3685 region touched on September 8, which if cleared decisively will be seen as a fresh trigger for bullish traders.
On the flip side, the 7.2700 level now seems to protect the immediate downside ahead of Friday’s low, around the 7.2595 zone and the 50-day SMA, currently pegged around the 7.2435 zone. A convincing break below the latter could prompt aggressive technical selling and drag the USD/CNH pair below the monthly low, around the 7.2390 region, towards testing the next relevant support near the 7.2135-7.2130 region.
Technical Levels: Supports and Resistances
USDCNH currently trading at 7.2884 at the time of writing. Pair opened at 7.28 and is trading with a change of 0.12 % .
| Overview | Overview.1 | |
|---|---|---|
| 0 | Today last price | 7.2884 |
| 1 | Today Daily Change | 0.0084 |
| 2 | Today Daily Change % | 0.1200 |
| 3 | Today daily open | 7.2800 |
The pair is trading below its 20 Daily moving average @ 7.2969, above its 50 Daily moving average @ 7.2449 , above its 100 Daily moving average @ 7.1734 and above its 200 Daily moving average @ 7.025
| Trends | Trends.1 | |
|---|---|---|
| 0 | Daily SMA20 | 7.2969 |
| 1 | Daily SMA50 | 7.2449 |
| 2 | Daily SMA100 | 7.1734 |
| 3 | Daily SMA200 | 7.0250 |
The previous day high was 7.2952 while the previous day low was 7.2596. The daily 38.2% Fib levels comes at 7.2732, expected to provide support. Similarly, the daily 61.8% fib level is at 7.2817, expected to provide support.
Note the levels of interest below:
- Pivot support is noted at 7.2614, 7.2427, 7.2258
- Pivot resistance is noted at 7.297, 7.3139, 7.3326
| Levels | Levels.1 |
|---|---|
| Previous Daily High | 7.2952 |
| Previous Daily Low | 7.2596 |
| Previous Weekly High | 7.3652 |
| Previous Weekly Low | 7.2596 |
| Previous Monthly High | 7.3496 |
| Previous Monthly Low | 7.1452 |
| Daily Fibonacci 38.2% | 7.2732 |
| Daily Fibonacci 61.8% | 7.2817 |
| Daily Pivot Point S1 | 7.2614 |
| Daily Pivot Point S2 | 7.2427 |
| Daily Pivot Point S3 | 7.2258 |
| Daily Pivot Point R1 | 7.2970 |
| Daily Pivot Point R2 | 7.3139 |
| Daily Pivot Point R3 | 7.3326 |
[/s2If]
Download Nehcap EAWe have two EAs that are operational on our LIVE accounts.
- EA-FIX: Check out the details here. Download EA-FIX . EA-FIX is a non-grid HFT scalper.
- EA-GROWTH: High quality low dd EA using trend grids. Download EA_GROWTHJoin Our Telegram Group


