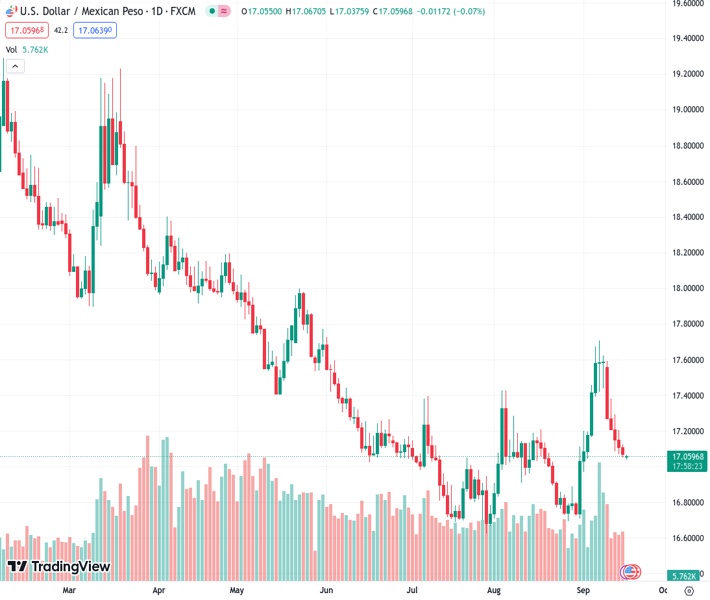
The US dollar to Mexican peso exchange rate declines for the seventh consecutive day, falling to a level not seen in over two weeks on Monday.
…
This is a premium post.
[s2If !current_user_can(access_s2member_level4)]Please register for FREE REGISTER to read full post below containing analysis. In case of any error or you think you are not able to read the full post below, please email us at support#nehcap.com [lwa][/s2If] [s2If current_user_can(access_s2member_level1)]
- USD/MXN edges lower for the seventh straight day and touches over a two-week low on Monday.
The pair currently trades last at 17.0580.
The previous day high was 17.1269 while the previous day low was 17.0504. The daily 38.2% Fib levels comes at 17.0796, expected to provide resistance. Similarly, the daily 61.8% fib level is at 17.0977, expected to provide resistance.
The USD/MXN pair remains depressed for the seventh straight day and slides to over a two-week low, around the 17.0485 level during the Asian session on Monday.
From a technical perspective, acceptance below the 61.8% Fibonacci retracement level of the rally from the August monthly swing low might have already set the stage for a further depreciating move for spot prices. The negative outlook is reinforced by the fact that oscillators on the daily chart have just started drifting into bearish territory. This, in turn, suggests that the path of least resistance for the USD/MXN pair is to the downside.
That said, it will still be prudent to wait for a convincing break below the 50-day Simple Moving Average (SMA), currently pegged around the 17.0270 area, before placing fresh bearish bets. The USD/MXN pair might then turn vulnerable to weaken further below the 17.0000 psychological mark, towards testing the next relevant support near the 16.8885 area before dropping to the multi-year trough, near the 16.6945 region touched in August.
On the flip side, any meaningful recovery might now confront stiff resistance and is more likely to remain capped near the 17.2060-17.2280 confluence, comprising the 50% Fibo. level and the 100-day SMA. Some follow-through buying, however, should lift the USD/MXN pair to the 38.2% Fibo. level, around the 17.3300 region en route to the 23.6% Fibo. barrier near the 17.4775 area and the multi-month top, around the 17.7090-17.7095 zone.
Technical Levels: Supports and Resistances
USDMXN currently trading at 17.0581 at the time of writing. Pair opened at 17.0782 and is trading with a change of -0.12 % .
| Overview | Overview.1 | |
|---|---|---|
| 0 | Today last price | 17.0581 |
| 1 | Today Daily Change | -0.0201 |
| 2 | Today Daily Change % | -0.1200 |
| 3 | Today daily open | 17.0782 |
The pair is trading below its 20 Daily moving average @ 17.0986, above its 50 Daily moving average @ 17.015 , below its 100 Daily moving average @ 17.2333 and below its 200 Daily moving average @ 17.9561
| Trends | Trends.1 | |
|---|---|---|
| 0 | Daily SMA20 | 17.0986 |
| 1 | Daily SMA50 | 17.0150 |
| 2 | Daily SMA100 | 17.2333 |
| 3 | Daily SMA200 | 17.9561 |
The previous day high was 17.1269 while the previous day low was 17.0504. The daily 38.2% Fib levels comes at 17.0796, expected to provide resistance. Similarly, the daily 61.8% fib level is at 17.0977, expected to provide resistance.
Note the levels of interest below:
- Pivot support is noted at 17.0434, 17.0087, 16.9669
- Pivot resistance is noted at 17.1199, 17.1617, 17.1964
| Levels | Levels.1 |
|---|---|
| Previous Daily High | 17.1269 |
| Previous Daily Low | 17.0504 |
| Previous Weekly High | 17.5959 |
| Previous Weekly Low | 17.0504 |
| Previous Monthly High | 17.4274 |
| Previous Monthly Low | 16.6945 |
| Daily Fibonacci 38.2% | 17.0796 |
| Daily Fibonacci 61.8% | 17.0977 |
| Daily Pivot Point S1 | 17.0434 |
| Daily Pivot Point S2 | 17.0087 |
| Daily Pivot Point S3 | 16.9669 |
| Daily Pivot Point R1 | 17.1199 |
| Daily Pivot Point R2 | 17.1617 |
| Daily Pivot Point R3 | 17.1964 |
[/s2If]
Download Nehcap EAWe have two EAs that are operational on our LIVE accounts.
- EA-FIX: Check out the details here. Download EA-FIX . EA-FIX is a non-grid HFT scalper.
- EA-GROWTH: High quality low dd EA using trend grids. Download EA_GROWTHJoin Our Telegram Group


