The AUDUSD currency pair, which was previously trading at 0.64312, experiences a decline to 0.632, representing a decrease of 0.12%. This reversal in the currency’s value comes after it had initially risen due to the release of encouraging economic information from China, Australia’s primary trading ally.
…
This is a premium post.
[s2If !current_user_can(access_s2member_level4)]Please register for FREE REGISTER to read full post below containing analysis. In case of any error or you think you are not able to read the full post below, please email us at support#nehcap.com [lwa][/s2If] [s2If current_user_can(access_s2member_level1)]
- AUD/USD drops to 0.632, down 0.12%, reversing earlier gains spurred by positive economic data from China, Australia’s largest trade partner.
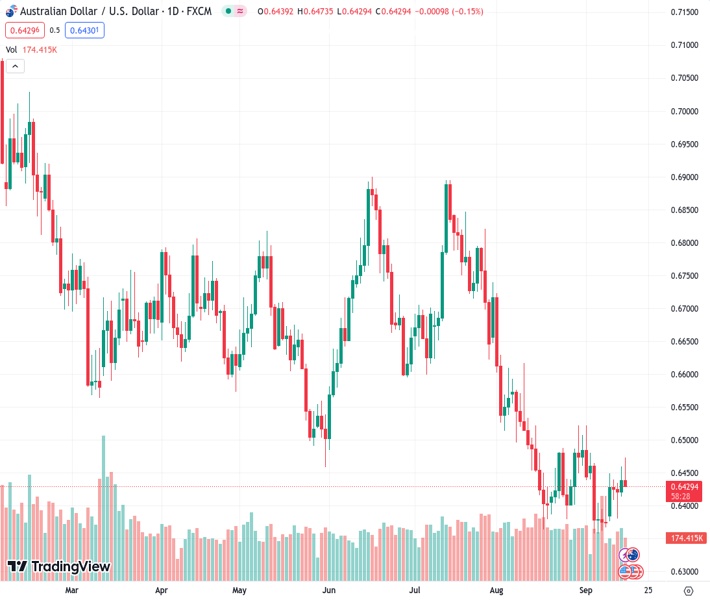
The pair currently trades last at 0.64312.
The previous day high was 0.646 while the previous day low was 0.6416. The daily 38.2% Fib levels comes at 0.6443, expected to provide resistance. Similarly, the daily 61.8% fib level is at 0.6433, expected to provide resistance.
The Australian Dollar reversed its course against the US Dollar after registering gains during the Asian session. Late in the North American session, the AUD/USD is trading at 0.632, losing 0.12% after reaching a daily high of 0.6473.
The economy in the United States (US) keeps surprising economists, as it remains more resilient than expected despite 525 basis points of tightening by the US Federal Reserve. Two indicators of manufacturing and industrial activity came better than expected, while Americans are optimistic that elevated prices would wane, as revealed by a University of Michigan poll.
The New York Fed revealed the Empire State Manufacturing Index, which improved after printing a mediocre -21 print in August, improved to 1.9, beating forecasts of a -10 plunge. At the same time, the Federal Reserve showed that Industrial Production expanded by 0.4% MoM, beneath July’s 1% but above the consensus forecasts.
The University of Michigan recently revealed that although inflation expectations remain not as close to the Fed’s 2% goal, they have subsided. Americans estimate inflation in one year at 3.1%, below August’s 3.5, while for ten years, they expected prices to drop to 2.7%. Regarding how they feel about the economy, known as Consumer Sentiment, the index deteriorated from 69.1 forecasts to 67.7.
Today’s data, summed up with the previous one revealed in the week, raised speculation the Fed might achieve a soft landing. In the meantime, money market futures remain certain the Fed would skip hiking rates in September, but odds for a 25 bps hike at the November meeting lie at a decent 32.45% chance.
Earlier, the additional stimulus provided by Chinese authorities is giving results on its economy, as revealed by the latest economic figures, which bolstered the Aussie, as China is Australia’s largest trade partner. Industrial Production in August rose above the prior’s reading and estimates, and retail sales jumped by 4.6% YoY, up from July 2.5% exceeding estimates.
The daily chart portrays the US Dollar might continue to appreciate against the Aussie, with next week’s Fed decision looming. The major remains downward biased, with the 200 and 50-day Moving Averages (DMAs) slopes aiming south while price action continues to dive lower, approaching the year-to-date (YTD) low of 0.6357. As of writing, the first support would be 0.6400, followed by the latter, and the next floor would be the November 22 swing low of 0.6272.
Technical Levels: Supports and Resistances
AUDUSD currently trading at 0.6433 at the time of writing. Pair opened at 0.644 and is trading with a change of -0.11 % .
| Overview | Overview.1 | |
|---|---|---|
| 0 | Today last price | 0.6433 |
| 1 | Today Daily Change | -0.0007 |
| 2 | Today Daily Change % | -0.1100 |
| 3 | Today daily open | 0.6440 |
The pair is trading above its 20 Daily moving average @ 0.6428, below its 50 Daily moving average @ 0.6562 , below its 100 Daily moving average @ 0.6619 and below its 200 Daily moving average @ 0.6707
| Trends | Trends.1 | |
|---|---|---|
| 0 | Daily SMA20 | 0.6428 |
| 1 | Daily SMA50 | 0.6562 |
| 2 | Daily SMA100 | 0.6619 |
| 3 | Daily SMA200 | 0.6707 |
The previous day high was 0.646 while the previous day low was 0.6416. The daily 38.2% Fib levels comes at 0.6443, expected to provide resistance. Similarly, the daily 61.8% fib level is at 0.6433, expected to provide resistance.
Note the levels of interest below:
- Pivot support is noted at 0.6417, 0.6395, 0.6373
- Pivot resistance is noted at 0.6462, 0.6483, 0.6506
| Levels | Levels.1 |
|---|---|
| Previous Daily High | 0.6460 |
| Previous Daily Low | 0.6416 |
| Previous Weekly High | 0.6480 |
| Previous Weekly Low | 0.6357 |
| Previous Monthly High | 0.6724 |
| Previous Monthly Low | 0.6364 |
| Daily Fibonacci 38.2% | 0.6443 |
| Daily Fibonacci 61.8% | 0.6433 |
| Daily Pivot Point S1 | 0.6417 |
| Daily Pivot Point S2 | 0.6395 |
| Daily Pivot Point S3 | 0.6373 |
| Daily Pivot Point R1 | 0.6462 |
| Daily Pivot Point R2 | 0.6483 |
| Daily Pivot Point R3 | 0.6506 |
[/s2If]
Download Nehcap EAWe have two EAs that are operational on our LIVE accounts.
- EA-FIX: Check out the details here. Download EA-FIX . EA-FIX is a non-grid HFT scalper.
- EA-GROWTH: High quality low dd EA using trend grids. Download EA_GROWTHJoin Our Telegram Group


