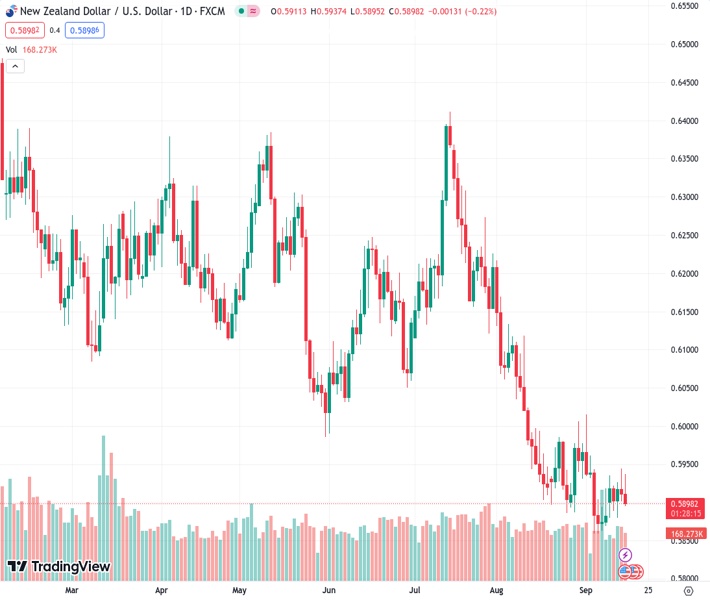
The New Zealand dollar against the US dollar is currently trading at 0.58983, with the kiwi currency remaining close to the middle point. It is expected to end Friday at a similar level as where it began.
…
This is a premium post.
[s2If !current_user_can(access_s2member_level4)]Please register for FREE REGISTER to read full post below containing analysis. In case of any error or you think you are not able to read the full post below, please email us at support#nehcap.com [lwa][/s2If] [s2If current_user_can(access_s2member_level1)]
- Kiwi holding near the middle, set to finish Friday near where it started.
The pair currently trades last at 0.58983.
The previous day high was 0.5945 while the previous day low was 0.5901. The daily 38.2% Fib levels comes at 0.5918, expected to provide resistance. Similarly, the daily 61.8% fib level is at 0.5929, expected to provide resistance.
The NZD/USD is set to finish Friday on a slight downstep, trading into the 0.5900 level and unable to find some lift.
With little meaningful momentum coming from the Kiwi (NZD) side of things, the NZD is fully exposed to broader market flows, leaving the Greenback (USD) to dictate the direction of the pair.
Risk appetite is being supported by additional stimulus from China, bolstering the Antipodeans and putting a floor beneath any major declines. Official Chinese data showed that industrial production and retail sales figures rose faster than expected, providing further support for market sentiment heading into the weekend.
Market flows for the NZD/USD are notably leaning into the US Dollar side, and the direction is following the broader Dollar Index. The USD saw some hesitation after the University of Michigan (UoM) Sentiment Index missed expectations, slipping more than expected to 67.7 from 69.5. Inflation expectations also slid from 3.0% to 2.7%.
The USD is now catching some bids across the board as markets ease into the week’s market close.
The Kiwi is constrained near the middle of price congestion that has become familiar territory for this trading week, caught in a rough near-term range between 0.5930 and 0.5890.
Upside momentum will be constrained by the last swing high near 0.5980 on the daily candlesticks, which show the pair decidedly on the low end. Support is coming from September’s lows near 0.5860, and a further break to the downside sees little in the way of additional technical support.
The 50- and 100-day Simple Moving Averages (SMAs) are in a bearish decline, piled up at 0.6060 and 0.6120 respectively, and breaks above the 100-day SMA have struggled to sustain for some time in the NZD/USD pair.
Technical Levels: Supports and Resistances
NZDUSD currently trading at 0.5904 at the time of writing. Pair opened at 0.5912 and is trading with a change of -0.14 % .
| Overview | Overview.1 | |
|---|---|---|
| 0 | Today last price | 0.5904 |
| 1 | Today Daily Change | -0.0008 |
| 2 | Today Daily Change % | -0.1400 |
| 3 | Today daily open | 0.5912 |
The pair remains strongly bearish on the daily time frame. It trades below the 20 SMA @ 0.5923, 50 SMA 0.606, 100 SMA @ 0.6114 and 200 SMA @ 0.6202.
| Trends | Trends.1 | |
|---|---|---|
| 0 | Daily SMA20 | 0.5923 |
| 1 | Daily SMA50 | 0.6060 |
| 2 | Daily SMA100 | 0.6114 |
| 3 | Daily SMA200 | 0.6202 |
The previous day high was 0.5945 while the previous day low was 0.5901. The daily 38.2% Fib levels comes at 0.5918, expected to provide resistance. Similarly, the daily 61.8% fib level is at 0.5929, expected to provide resistance.
Note the levels of interest below:
- Pivot support is noted at 0.5894, 0.5876, 0.585
- Pivot resistance is noted at 0.5938, 0.5964, 0.5982
| Levels | Levels.1 |
|---|---|
| Previous Daily High | 0.5945 |
| Previous Daily Low | 0.5901 |
| Previous Weekly High | 0.5961 |
| Previous Weekly Low | 0.5847 |
| Previous Monthly High | 0.6219 |
| Previous Monthly Low | 0.5885 |
| Daily Fibonacci 38.2% | 0.5918 |
| Daily Fibonacci 61.8% | 0.5929 |
| Daily Pivot Point S1 | 0.5894 |
| Daily Pivot Point S2 | 0.5876 |
| Daily Pivot Point S3 | 0.5850 |
| Daily Pivot Point R1 | 0.5938 |
| Daily Pivot Point R2 | 0.5964 |
| Daily Pivot Point R3 | 0.5982 |
[/s2If]
Download Nehcap EAWe have two EAs that are operational on our LIVE accounts.
- EA-FIX: Check out the details here. Download EA-FIX . EA-FIX is a non-grid HFT scalper.
- EA-GROWTH: High quality low dd EA using trend grids. Download EA_GROWTHJoin Our Telegram Group


