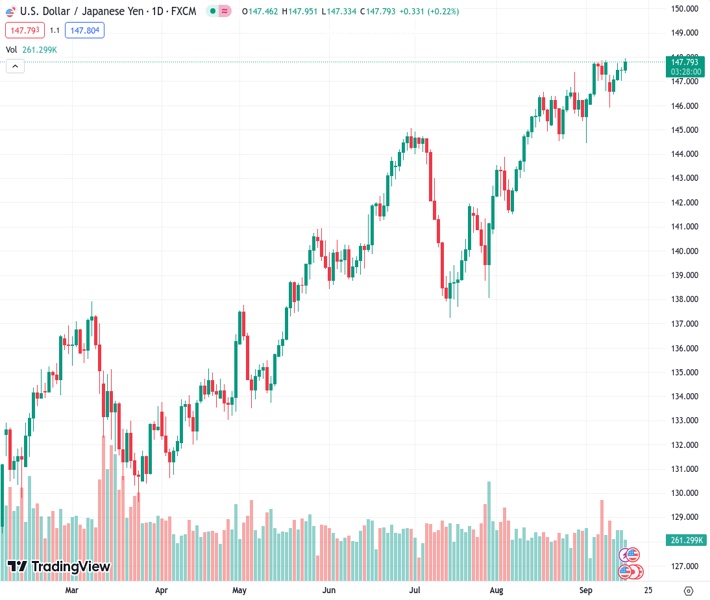
The currency pair USDJPY reached new highs close to 147.85 after advancing from 147.802.
…
This is a premium post.
[s2If !current_user_can(access_s2member_level4)]Please register for FREE REGISTER to read full post below containing analysis. In case of any error or you think you are not able to read the full post below, please email us at support#nehcap.com [lwa][/s2If] [s2If current_user_can(access_s2member_level1)]
- USD/JPY advanced to fresh multi-month highs near 147.85
The pair currently trades last at 147.802.
The previous day high was 147.57 while the previous day low was 147.02. The daily 38.2% Fib levels comes at 147.36, expected to provide support. Similarly, the daily 61.8% fib level is at 147.23, expected to provide support.
Ahead of the weekend, the USD/JPY pair resumed its upward path, rising to 147.85 and will record a second consecutive weekly gain. On the USD side, the greenback traded soft and faced selling pressure after soft consumer sentiment figures from the US from September. However, the DXY index will close its eight-consecutive winning week, gaining more than 5% in July. On the other hand, the JPY gave up all gains seen by Ueda’s comments earlier this week and the Bank of Japan (BoJ) dovish stance, leaves the Yen vulnerable.
During the week, key inflation data from the US from August measured by the Consumer Price Index (CPI) came in higher than expected. In addition, economic activity figures, including Retail Sales from the same month and Jobless Claims for the second week of September, also showed good news for the US economy.
Regarding expectations on the Federal Reserve (Fed), according to the CME FedWatch tool, the odds of one last hike slightly decline but remain relatively high, around 35%. That decline may be explained by the European Central Bank’s (ECB) dovish tone on Thursday after it decided to hike by 25 bps and Christine Lagarde refrained from committing to another hike. Nevertheless, the US economy is not cooling down, and Fed officials have all the reasons to hike one last time.
On the JPY front, as highlighted by the BoJ, local wage and inflation trends are key drivers in the decision-making process around monetary policy shifts. On Monday, Governor Ueda commented that the bank may gather enough data by years-end to consider a pivot which lifted the Yen during the week, but that momentum slowly faded. For next week’s BoJ meeting, no changes in the ultra-loose policy are expected, but markets will monitor any changes in the economic forecast.
As per the daily chart analysis, the USD/JPY has a bullish technical bias for the short term. The Relative Strength Index (RSI) also exhibits a northward slope above its midline, emphasising the presence of strong buying pressure, while the MACD, with its green bars, highlights the strengthening bullish momentum of the USD/JPY. On the other hand, the pair is above the 20,100,200-day Simple Moving Average (SMA), indicating that the buyers are commanding the broader perspective.
Support levels: 147.00, 146.60 (20-day SMA), 146.00.
Resistance levels: 148.00, 149.00, 150.00.
Technical Levels: Supports and Resistances
USDJPY currently trading at 147.86 at the time of writing. Pair opened at 147.48 and is trading with a change of 0.26 % .
| Overview | Overview.1 | |
|---|---|---|
| 0 | Today last price | 147.86 |
| 1 | Today Daily Change | 0.38 |
| 2 | Today Daily Change % | 0.26 |
| 3 | Today daily open | 147.48 |
The pair remains strongly bullish on the daily timeframe. It trades above its 20 SMA @ 146.53, 50 SMA 143.76, 100 SMA @ 141.7 and 200 SMA @ 137.3.
| Trends | Trends.1 | |
|---|---|---|
| 0 | Daily SMA20 | 146.53 |
| 1 | Daily SMA50 | 143.76 |
| 2 | Daily SMA100 | 141.70 |
| 3 | Daily SMA200 | 137.30 |
The previous day high was 147.57 while the previous day low was 147.02. The daily 38.2% Fib levels comes at 147.36, expected to provide support. Similarly, the daily 61.8% fib level is at 147.23, expected to provide support.
Note the levels of interest below:
- Pivot support is noted at 147.14, 146.8, 146.59
- Pivot resistance is noted at 147.69, 147.9, 148.24
| Levels | Levels.1 |
|---|---|
| Previous Daily High | 147.57 |
| Previous Daily Low | 147.02 |
| Previous Weekly High | 147.88 |
| Previous Weekly Low | 146.02 |
| Previous Monthly High | 147.38 |
| Previous Monthly Low | 141.51 |
| Daily Fibonacci 38.2% | 147.36 |
| Daily Fibonacci 61.8% | 147.23 |
| Daily Pivot Point S1 | 147.14 |
| Daily Pivot Point S2 | 146.80 |
| Daily Pivot Point S3 | 146.59 |
| Daily Pivot Point R1 | 147.69 |
| Daily Pivot Point R2 | 147.90 |
| Daily Pivot Point R3 | 148.24 |
[/s2If]
Download Nehcap EAWe have two EAs that are operational on our LIVE accounts.
- EA-FIX: Check out the details here. Download EA-FIX . EA-FIX is a non-grid HFT scalper.
- EA-GROWTH: High quality low dd EA using trend grids. Download EA_GROWTHJoin Our Telegram Group


