The USD/CHF currency pair is experiencing slight declines around the 0.8930 level due to the US dollar’s weakness.
…
This is a premium post.
[s2If !current_user_can(access_s2member_level4)]Please register for FREE REGISTER to read full post below containing analysis. In case of any error or you think you are not able to read the full post below, please email us at support#nehcap.com [lwa][/s2If] [s2If current_user_can(access_s2member_level1)]
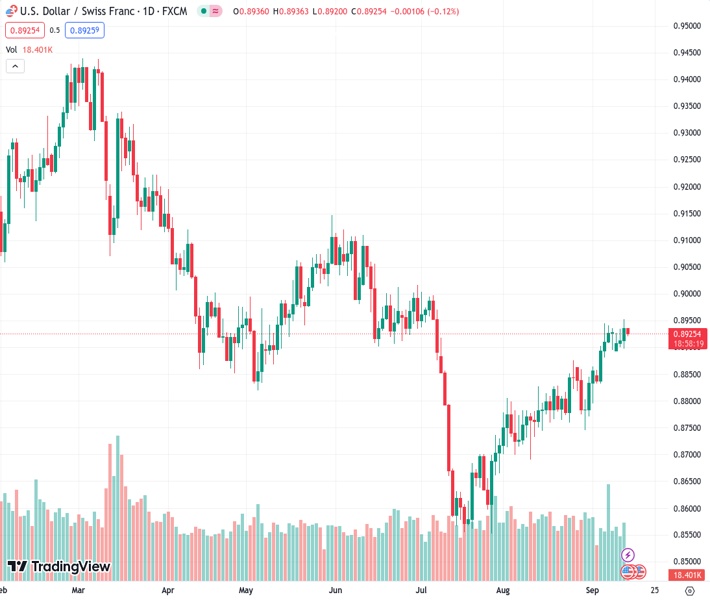
- USD/CHF posts modest losses near 0.8930 amid the weaker USD.
The pair currently trades last at 0.89253.
The previous day high was 0.8952 while the previous day low was 0.8907. The daily 38.2% Fib levels comes at 0.8935, expected to provide resistance. Similarly, the daily 61.8% fib level is at 0.8924, expected to provide support.
The USD/CHF pair snaps a two-day winning streak during the early Asian trading hours on Thursday. Meanwhile, the US Dollar Index (DXY), a measure of the value of USD against six other major currencies, hovers around 104.65 after retreating from 104.96 in response to the US inflation data. The pair currently trades near 0.8930, losing 0.10% on the day.
On Wednesday, the US Bureau of Labor Statistics showed that the headline inflation in August hit the highest monthly gain in 14 months with the US Consumer Price Index (CPI) rising 0.6% MoM from 0.2% in the previous reading. The annual figure came in at 3.7% from 3.2%, better than expected. The core CPI, which excludes volatile food and energy prices climbed 0.3% MoM from 0.2% in the previous month. The annual core CPI came in at 4.3% versus 4.7% prior.
The Greenback (USD) surged and later lost traction in response to the data as the markets believe that interest rates will remain unchanged at next week’s FOMC meeting. However, the figures imply that the Fed should be on the lookout for any re-acceleration in inflation in the next months. Investors have priced in 97% odds of interest rate unchanged in September at 5.25%-5.50%. However, the possibility of a rate hike in the November meeting increased to 49.2%, according to the CME Fedwatch Tool.
In the quiet week of economic data release from Switzerland, the risk sentiment and the USD dynamic will be the main driver for the USD/CHF pair. On Tuesday, US Commerce Secretary Gina Raimondo is set to meet with the CEOs of key American corporations this week, two weeks after visiting China and raising worries about business conditions, per Reuters. The renewed trade war tension between the US and China might exert some selling pressure on the USD and act as a headwind for the headwind for USD/CHF pair.
Looking ahead, market players will focus on the Swiss Producer and Import Prices for August due later on Thursday. Also, the release of the US weekly Initial Jobless Claims, the Producer Price Index (PPI), and monthly Retail Sales will remain in the spotlight. These figures could give a clear direction for the USD/CHF pair.
Technical Levels: Supports and Resistances
USDCHF currently trading at 0.8928 at the time of writing. Pair opened at 0.8937 and is trading with a change of -0.1 % .
| Overview | Overview.1 | |
|---|---|---|
| 0 | Today last price | 0.8928 |
| 1 | Today Daily Change | -0.0009 |
| 2 | Today Daily Change % | -0.1000 |
| 3 | Today daily open | 0.8937 |
The pair is trading above its 20 Daily moving average @ 0.8852, above its 50 Daily moving average @ 0.8774 , above its 100 Daily moving average @ 0.888 and below its 200 Daily moving average @ 0.9046
| Trends | Trends.1 | |
|---|---|---|
| 0 | Daily SMA20 | 0.8852 |
| 1 | Daily SMA50 | 0.8774 |
| 2 | Daily SMA100 | 0.8880 |
| 3 | Daily SMA200 | 0.9046 |
The previous day high was 0.8952 while the previous day low was 0.8907. The daily 38.2% Fib levels comes at 0.8935, expected to provide resistance. Similarly, the daily 61.8% fib level is at 0.8924, expected to provide support.
Note the levels of interest below:
- Pivot support is noted at 0.8912, 0.8887, 0.8867
- Pivot resistance is noted at 0.8957, 0.8977, 0.9002
| Levels | Levels.1 |
|---|---|
| Previous Daily High | 0.8952 |
| Previous Daily Low | 0.8907 |
| Previous Weekly High | 0.8945 |
| Previous Weekly Low | 0.8833 |
| Previous Monthly High | 0.8876 |
| Previous Monthly Low | 0.8690 |
| Daily Fibonacci 38.2% | 0.8935 |
| Daily Fibonacci 61.8% | 0.8924 |
| Daily Pivot Point S1 | 0.8912 |
| Daily Pivot Point S2 | 0.8887 |
| Daily Pivot Point S3 | 0.8867 |
| Daily Pivot Point R1 | 0.8957 |
| Daily Pivot Point R2 | 0.8977 |
| Daily Pivot Point R3 | 0.9002 |
[/s2If]
Download Nehcap EAWe have two EAs that are operational on our LIVE accounts.
- EA-FIX: Check out the details here. Download EA-FIX . EA-FIX is a non-grid HFT scalper.
- EA-GROWTH: High quality low dd EA using trend grids. Download EA_GROWTHJoin Our Telegram Group


