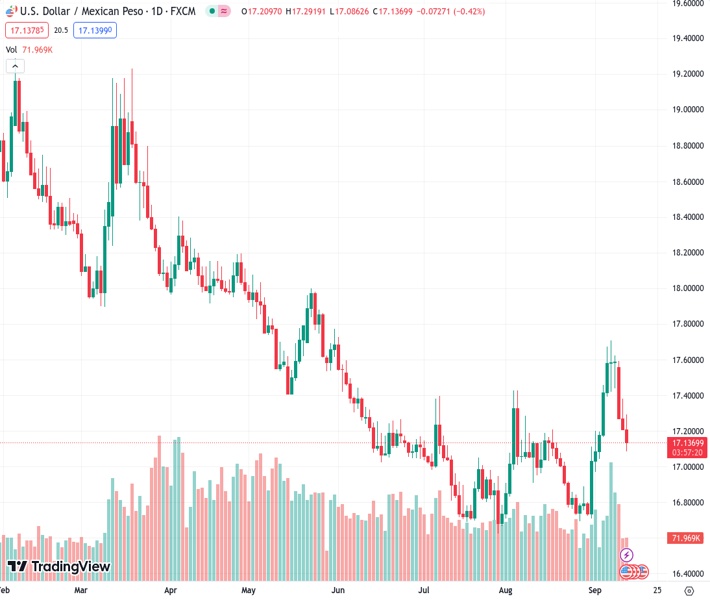
The US dollar to Mexican peso exchange rate, currently at 17.1337, is now at 17.1200, experiencing a decrease of 0.53%. This movement occurred after the US Consumer Price Index (CPI) for August was slightly higher than the expected forecast of 3.6%.
…
This is a premium post.
[s2If !current_user_can(access_s2member_level4)]Please register for FREE REGISTER to read full post below containing analysis. In case of any error or you think you are not able to read the full post below, please email us at support#nehcap.com [lwa][/s2If] [s2If current_user_can(access_s2member_level1)]
- USD/MXN trades at 17.1200, down 0.53%, after US CPI for August comes slightly above the 3.6% forecast.
The pair currently trades last at 17.1337.
The previous day high was 17.3811 while the previous day low was 17.2167. The daily 38.2% Fib levels comes at 17.2795, expected to provide resistance. Similarly, the daily 61.8% fib level is at 17.3183, expected to provide resistance.
The Mexican Peso (MXN) shrinks its losses and stages a comeback against the US Dollar (USD), after data from the United States (US) further cemented the case for the US Federal Reserve to hike rates at the September meeting. The USD/MXN is trading at 17.1200, down 0.53, after reaching a daily high of 17.2919.
US inflation exceeded estimates, as August’s Consumer Price Index (CPI) came at 3.7% YoY, while forecasts saw inflation at 3.6% above July data. Contrarily, core inflation dropped from 4.7% YoY in July to 4.3%, as projected by analysts, painting a mixed picture of inflation. Nevertheless, the data failed to price in additional tightening by the US Federal Reserve (Fed), as shown by money market futures data.
The CME FedWatch Tool still sees the Fed would keep rates at around the 5.25%-5.50% range for the upcoming September meeting, but for November, odds for a 25 bps rate hike are at 41%.
Nevertheless, USD bears are not out of the woods yet, as labor market data still shows signs of a hot jobs market. Unemployment claims for the last week are expected to rise to 225K, above the previous 216K reading. That, alongside August’s Retail Sales report, which is foreseen to come weaker than July’s numbers, could cement the case for an end of the Fed’s tightening cycle.
Additional inflation data will be revealed on Thursday, with the Producer Price Index (PPI) foreseen to continue decelerating.
If the data shows signs of an economic slowdown for the US, expect the USD/MXN to test the 17.0000 figure, as the interest rate difference between Mexico and the US favors the former, with Banxico’s TIIE at 11.25%, compared to the effective Federal Funds Rate (FFR) at 5.33%.
Even though the USD/MXN has retraced somewhat, the pair remains neutral to upward bias unless Mexican Peso buyers reclaim the August 28 daily low of 16.6924. However, it could challenge the psychological 17.00 figure, but traders must crack solid support standing in its way. Before testing the former, the 20-day Moving Average (DMA) is at 17.0902, followed by the 50-DMA at 17.0108. Conversely, a bullish continuation would resume once buyers reclaim the 100-DMA at 17.2452.
Technical Levels: Supports and Resistances
USDMXN currently trading at 17.1384 at the time of writing. Pair opened at 17.2274 and is trading with a change of -0.52 % .
| Overview | Overview.1 | |
|---|---|---|
| 0 | Today last price | 17.1384 |
| 1 | Today Daily Change | -0.0890 |
| 2 | Today Daily Change % | -0.5200 |
| 3 | Today daily open | 17.2274 |
The pair is trading above its 20 Daily moving average @ 17.0964, above its 50 Daily moving average @ 17.0159 , below its 100 Daily moving average @ 17.2617 and below its 200 Daily moving average @ 17.9948
| Trends | Trends.1 | |
|---|---|---|
| 0 | Daily SMA20 | 17.0964 |
| 1 | Daily SMA50 | 17.0159 |
| 2 | Daily SMA100 | 17.2617 |
| 3 | Daily SMA200 | 17.9948 |
The previous day high was 17.3811 while the previous day low was 17.2167. The daily 38.2% Fib levels comes at 17.2795, expected to provide resistance. Similarly, the daily 61.8% fib level is at 17.3183, expected to provide resistance.
Note the levels of interest below:
- Pivot support is noted at 17.1691, 17.1107, 17.0047
- Pivot resistance is noted at 17.3335, 17.4395, 17.4979
| Levels | Levels.1 |
|---|---|
| Previous Daily High | 17.3811 |
| Previous Daily Low | 17.2167 |
| Previous Weekly High | 17.7094 |
| Previous Weekly Low | 17.0447 |
| Previous Monthly High | 17.4274 |
| Previous Monthly Low | 16.6945 |
| Daily Fibonacci 38.2% | 17.2795 |
| Daily Fibonacci 61.8% | 17.3183 |
| Daily Pivot Point S1 | 17.1691 |
| Daily Pivot Point S2 | 17.1107 |
| Daily Pivot Point S3 | 17.0047 |
| Daily Pivot Point R1 | 17.3335 |
| Daily Pivot Point R2 | 17.4395 |
| Daily Pivot Point R3 | 17.4979 |
[/s2If]
Download Nehcap EAWe have two EAs that are operational on our LIVE accounts.
- EA-FIX: Check out the details here. Download EA-FIX . EA-FIX is a non-grid HFT scalper.
- EA-GROWTH: High quality low dd EA using trend grids. Download EA_GROWTHJoin Our Telegram Group


