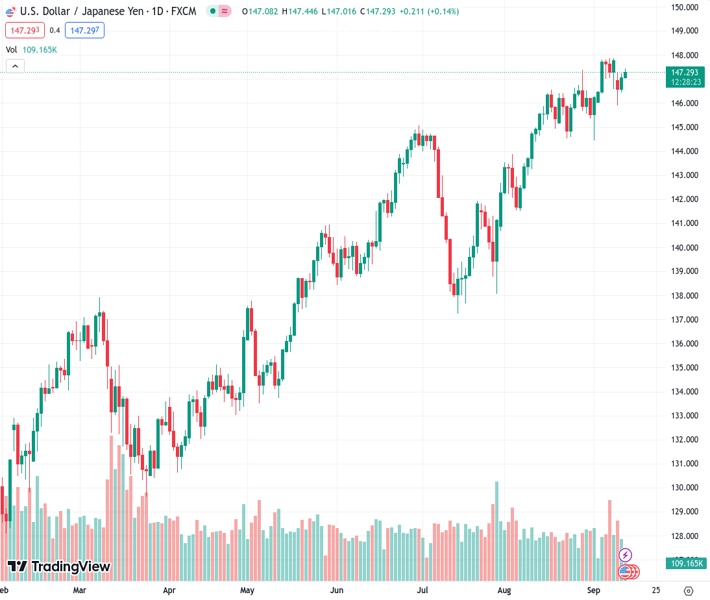
The USDJPY currency pair has gained momentum and increased for the second consecutive day, reaching a new weekly high on Wednesday at a rate of 147.310.
…
This is a premium post.
[s2If !current_user_can(access_s2member_level4)]Please register for FREE REGISTER to read full post below containing analysis. In case of any error or you think you are not able to read the full post below, please email us at support#nehcap.com [lwa][/s2If] [s2If current_user_can(access_s2member_level1)]
- USD/JPY scales higher for the second straight day and refreshes weekly high on Wednesday.
The pair currently trades last at 147.310.
The previous day high was 147.24 while the previous day low was 146.44. The daily 38.2% Fib levels comes at 146.93, expected to provide support. Similarly, the daily 61.8% fib level is at 146.74, expected to provide support.
The USD/JPY pair gains some positive traction for the second successive day and climbs to a fresh weekly high during the first half of trading action on Wednesday. Spot prices, however, remain below mid-147.00s through the early European session as traders keenly await the US consumer inflation figures before placing fresh directional bets.
The crucial US CPI report is scheduled for release later during the early North American session and will play a key role in influencing the Federal Reserve’s (Fed) policy outlook. This, in turn, will drive the USD demand and help investors determine the near-term trajectory for the USD/JPY pair. In the meantime, growing acceptance that the Fed will keep interest rates higher for longer assists the USD to attract some buying and acts as a tailwind for the major.
Investors seem convinced that the US central bank will stick to its hawkish stance and the bets were reaffirmed by the upbeat US macro data released last week, which pointed to a resilient economy. Furthermore, the recent rally in Crude Oil prices has been fueling concerns about the inflation outlook and supports prospects for further policy tightening by the Fed. The outlook remains supportive of elevated US Treasury bond yields and continues to underpin the buck.
The Japanese Yen (JPY), on the other hand, is weighed down by softer domestic data, showing that annual wholesale inflation, as measured by the Corporate Goods Price Index (CGPI), slowed in August for the eighth straight month. The index continued with its downward trend from the peak of 10.6% YoY rate recorded in December and eased to 3.2% during the reported month. The data ensures that the Bank of Japan (BoJ) will maintain the status quo until next summer.
This, along with the fact that the immediate market reaction to BoJ Governor Kazuo Ueda’s weekend comments on the negative interest rate policy was short-lived, suggests that the path of least resistance for the USD/JPY pair is to the upside. Hence, a subsequent move up towards the YTD peak, around the 147.85 area set last Friday, looks like a distinct possibility. Moreover, any corrective pullback might be seen as a buying opportunity and remain limited.
Technical Levels: Supports and Resistances
USDJPY currently trading at 147.3 at the time of writing. Pair opened at 147.08 and is trading with a change of 0.15 % .
| Overview | Overview.1 | |
|---|---|---|
| 0 | Today last price | 147.30 |
| 1 | Today Daily Change | 0.22 |
| 2 | Today Daily Change % | 0.15 |
| 3 | Today daily open | 147.08 |
The pair remains strongly bullish on the daily timeframe. It trades above its 20 SMA @ 146.4, 50 SMA 143.64, 100 SMA @ 141.43 and 200 SMA @ 137.19.
| Trends | Trends.1 | |
|---|---|---|
| 0 | Daily SMA20 | 146.40 |
| 1 | Daily SMA50 | 143.64 |
| 2 | Daily SMA100 | 141.43 |
| 3 | Daily SMA200 | 137.19 |
The previous day high was 147.24 while the previous day low was 146.44. The daily 38.2% Fib levels comes at 146.93, expected to provide support. Similarly, the daily 61.8% fib level is at 146.74, expected to provide support.
Note the levels of interest below:
- Pivot support is noted at 146.6, 146.12, 145.81
- Pivot resistance is noted at 147.4, 147.72, 148.2
| Levels | Levels.1 |
|---|---|
| Previous Daily High | 147.24 |
| Previous Daily Low | 146.44 |
| Previous Weekly High | 147.88 |
| Previous Weekly Low | 146.02 |
| Previous Monthly High | 147.38 |
| Previous Monthly Low | 141.51 |
| Daily Fibonacci 38.2% | 146.93 |
| Daily Fibonacci 61.8% | 146.74 |
| Daily Pivot Point S1 | 146.60 |
| Daily Pivot Point S2 | 146.12 |
| Daily Pivot Point S3 | 145.81 |
| Daily Pivot Point R1 | 147.40 |
| Daily Pivot Point R2 | 147.72 |
| Daily Pivot Point R3 | 148.20 |
[/s2If]
Download Nehcap EAWe have two EAs that are operational on our LIVE accounts.
- EA-FIX: Check out the details here. Download EA-FIX . EA-FIX is a non-grid HFT scalper.
- EA-GROWTH: High quality low dd EA using trend grids. Download EA_GROWTHJoin Our Telegram Group
")


