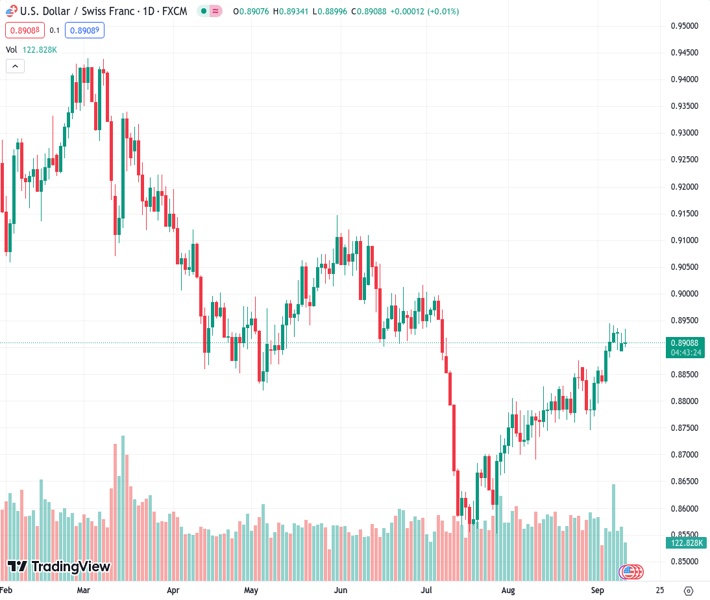
The currency pair USDCHF remains in a consolidation phase above the 100-day simple moving average (SMA), with a neutral trading stance around the level of 0.8910.
…
This is a premium post.
[s2If !current_user_can(access_s2member_level4)]Please register for FREE REGISTER to read full post below containing analysis. In case of any error or you think you are not able to read the full post below, please email us at support#nehcap.com [lwa][/s2If] [s2If current_user_can(access_s2member_level1)]
- USD/CHF continues to consolidate above the 100-day SMA trading neutral at 0.8910.
The pair currently trades last at 0.89093.
The previous day high was 0.893 while the previous day low was 0.8897. The daily 38.2% Fib levels comes at 0.891, expected to provide resistance. Similarly, the daily 61.8% fib level is at 0.8917, expected to provide resistance.
On Tuesday’s sessions, the USD/CHF tallied mild gains and traded near 0.8910. The USD is recovering ground after two consecutive days of trading weak against most of its rivals, while US yields are trading mixed in anticipation of Wednesday’s Consumer Price Index (CPI) from August. On the CHF’s side, the Swiss calendar had nothing relevant to offer in the session.
In that sense, the August CPI is expected to show a 0.5% increase MoM, while the Core measure is forecasted to rise by 0.2% on a monthly basis, and those inflation figures will play a big role in the model of expectations of the next Federal Reserve (Fed) decisions.
Meanwhile, according to the CME FedWatch tool, the market still believes that the Fed will take a break at the September 20 meeting. However, investors anticipate a 40% chance that the Fed might opt for one last interest rate hike in either November or December, which would lift rates to 5.75%.
The daily chart analysis shows that the short-term outlook for USD/CHF appears bullish. The Relative Strength Index (RSI) and Moving Average Convergence Divergence (MACD) maintain positive positions, with the RSI above its midline and displaying an upward trend, while the MACD exhibits green bars. On the other hand, the pair is above the 20 and 100-day Simple Moving Averages (SMAs) but below the 200-day SMA, suggesting that the bulls are in command over the bears on the bigger picture.
Support levels: 0.8900, 0.8877 (100-day SMA), 0.8850.
Resistance levels: 0.8950, 0.9000, 0.9030.
Technical Levels: Supports and Resistances
USDCHF currently trading at 0.8919 at the time of writing. Pair opened at 0.8909 and is trading with a change of 0.11 % .
| Overview | Overview.1 | |
|---|---|---|
| 0 | Today last price | 0.8919 |
| 1 | Today Daily Change | 0.0010 |
| 2 | Today Daily Change % | 0.1100 |
| 3 | Today daily open | 0.8909 |
The pair is trading above its 20 Daily moving average @ 0.8838, above its 50 Daily moving average @ 0.8776 , above its 100 Daily moving average @ 0.8879 and below its 200 Daily moving average @ 0.9051
| Trends | Trends.1 | |
|---|---|---|
| 0 | Daily SMA20 | 0.8838 |
| 1 | Daily SMA50 | 0.8776 |
| 2 | Daily SMA100 | 0.8879 |
| 3 | Daily SMA200 | 0.9051 |
The previous day high was 0.893 while the previous day low was 0.8897. The daily 38.2% Fib levels comes at 0.891, expected to provide resistance. Similarly, the daily 61.8% fib level is at 0.8917, expected to provide resistance.
Note the levels of interest below:
- Pivot support is noted at 0.8894, 0.8879, 0.8861
- Pivot resistance is noted at 0.8927, 0.8945, 0.8959
| Levels | Levels.1 |
|---|---|
| Previous Daily High | 0.8930 |
| Previous Daily Low | 0.8897 |
| Previous Weekly High | 0.8945 |
| Previous Weekly Low | 0.8833 |
| Previous Monthly High | 0.8876 |
| Previous Monthly Low | 0.8690 |
| Daily Fibonacci 38.2% | 0.8910 |
| Daily Fibonacci 61.8% | 0.8917 |
| Daily Pivot Point S1 | 0.8894 |
| Daily Pivot Point S2 | 0.8879 |
| Daily Pivot Point S3 | 0.8861 |
| Daily Pivot Point R1 | 0.8927 |
| Daily Pivot Point R2 | 0.8945 |
| Daily Pivot Point R3 | 0.8959 |
[/s2If]
Download Nehcap EAWe have two EAs that are operational on our LIVE accounts.
- EA-FIX: Check out the details here. Download EA-FIX . EA-FIX is a non-grid HFT scalper.
- EA-GROWTH: High quality low dd EA using trend grids. Download EA_GROWTHJoin Our Telegram Group


