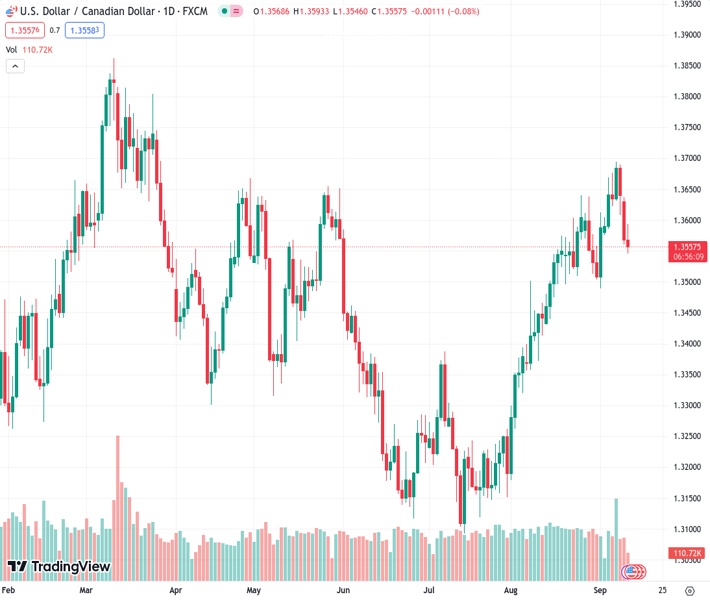
The USDCAD exchange rate is continuing to decrease, currently at 1.35544, as the price of oil bounces back strongly, driven by a positive outlook.
…
This is a premium post.
[s2If !current_user_can(access_s2member_level4)]Please register for FREE REGISTER to read full post below containing analysis. In case of any error or you think you are not able to read the full post below, please email us at support#nehcap.com [lwa][/s2If] [s2If current_user_can(access_s2member_level1)]
- USD/CAD extends losses amid a solid recovery in oil price due to an upbeat outlook.
The pair currently trades last at 1.35544.
The previous day high was 1.3639 while the previous day low was 1.3561. The daily 38.2% Fib levels comes at 1.3591, expected to provide resistance. Similarly, the daily 61.8% fib level is at 1.3609, expected to provide resistance.
The USD/CAD pair extends its two-day losing spell after slipping below Monday’s low of 1.3560 in the early New York session. The Loonie asset faces selling pressure as the oil price soars to near $90.00. Investors channel funds into the oil price as OPEC sees robust demand for energy, knowing that the learning curve of various economies in absorbing the burden of higher interest rates will improve significantly.
It is worth noting that Canada is the leading exporter of oil to the United States and higher oil prices are strengthening the Canadian Dollar.
S&P500 is expected to open on a slightly bearish note, considering negative cues from overnight futures. Meanwhile, investors remained cautious over August inflation data, which is scheduled for Wednesday.
As per the estimates, the headline inflation grew at 0.6% vs. the former reading of 0.2% due to rising gasoline prices. While core CPI that excludes volatile oil and food prices rose at a steady pace of 0.2%. The US Dollar Index (DXY) recovers further to near 104.90 as investors remain worried about the global slowdown.
A surprise rise in the inflationary pressures would force Federal Reserve (Fed) policymakers to focus more on further policy tightening as the ‘last mile’ of inflation above the desired rate of 2% will be a hard nut to crack.
On the Canadian Dollar front, stronger-than-anticipated labor market data could force the Bank of Canada (BoC) to raise interest rates further. The Canadian labor market witnessed 39.9K new payrolls in the overall laborforce in August, more than doubled the expectations of 15K. In July, the labor force witnessed a reduction of 6.4K payrolls. The Unemployment Rate remains unchanged at 5.5% while investors forecasted a higher jobless rate at 5.6%.
Technical Levels: Supports and Resistances
USDCAD currently trading at 1.3581 at the time of writing. Pair opened at 1.3572 and is trading with a change of 0.07 % .
| Overview | Overview.1 | |
|---|---|---|
| 0 | Today last price | 1.3581 |
| 1 | Today Daily Change | 0.0009 |
| 2 | Today Daily Change % | 0.0700 |
| 3 | Today daily open | 1.3572 |
The pair remains strongly bullish on the daily timeframe. It trades above its 20 SMA @ 1.3574, 50 SMA 1.3394, 100 SMA @ 1.3406 and 200 SMA @ 1.3467.
| Trends | Trends.1 | |
|---|---|---|
| 0 | Daily SMA20 | 1.3574 |
| 1 | Daily SMA50 | 1.3394 |
| 2 | Daily SMA100 | 1.3406 |
| 3 | Daily SMA200 | 1.3467 |
The previous day high was 1.3639 while the previous day low was 1.3561. The daily 38.2% Fib levels comes at 1.3591, expected to provide resistance. Similarly, the daily 61.8% fib level is at 1.3609, expected to provide resistance.
Note the levels of interest below:
- Pivot support is noted at 1.3542, 1.3513, 1.3465
- Pivot resistance is noted at 1.362, 1.3669, 1.3698
| Levels | Levels.1 |
|---|---|
| Previous Daily High | 1.3639 |
| Previous Daily Low | 1.3561 |
| Previous Weekly High | 1.3694 |
| Previous Weekly Low | 1.3576 |
| Previous Monthly High | 1.3640 |
| Previous Monthly Low | 1.3184 |
| Daily Fibonacci 38.2% | 1.3591 |
| Daily Fibonacci 61.8% | 1.3609 |
| Daily Pivot Point S1 | 1.3542 |
| Daily Pivot Point S2 | 1.3513 |
| Daily Pivot Point S3 | 1.3465 |
| Daily Pivot Point R1 | 1.3620 |
| Daily Pivot Point R2 | 1.3669 |
| Daily Pivot Point R3 | 1.3698 |
[/s2If]
Download Nehcap EAWe have two EAs that are operational on our LIVE accounts.
- EA-FIX: Check out the details here. Download EA-FIX . EA-FIX is a non-grid HFT scalper.
- EA-GROWTH: High quality low dd EA using trend grids. Download EA_GROWTHJoin Our Telegram Group


