There is some intraday selling of silver on Tuesday, but it doesn’t continue for long.
…
This is a premium post.
[s2If !current_user_can(access_s2member_level4)]Please register for FREE REGISTER to read full post below containing analysis. In case of any error or you think you are not able to read the full post below, please email us at support#nehcap.com [lwa][/s2If] [s2If current_user_can(access_s2member_level1)]
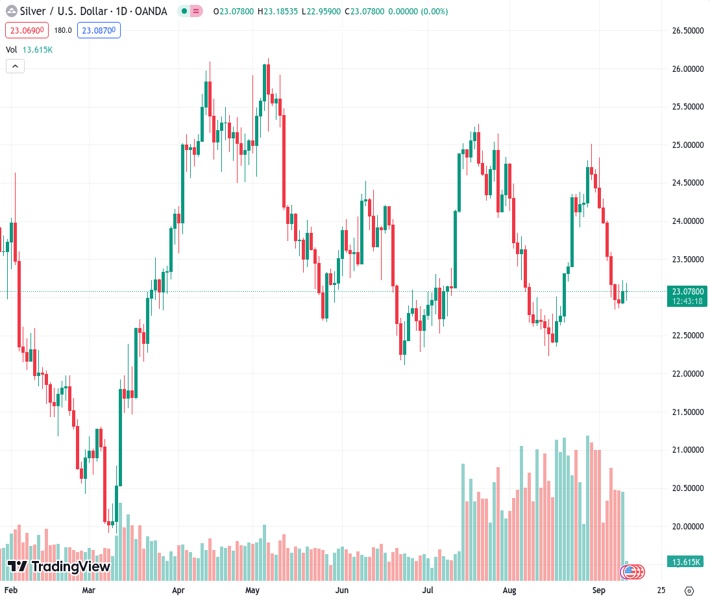
- Silver attracts some intraday selling on Tuesday, albeit lacks follow-through.
The pair currently trades last at 23.074.
The previous day high was 23.22 while the previous day low was 22.91. The daily 38.2% Fib levels comes at 23.1, expected to provide resistance. Similarly, the daily 61.8% fib level is at 23.03, expected to provide support.
Silver struggles to capitalize on the previous day’s modest recovery gains and attracts fresh sellers in the vicinity of the $23.20 area on Tuesday. The white metal extends its steady descent through the early part of the European session and hits a fresh daily low in the last hour, though shows some resilience below the $23.00 round-figure mark.
Looking at the broader picture, Silver has been oscillating in a familiar trading back since last Thursday. Against the backdrop of the recent sharp downfall from the $25.00 psychological mark, this range-bound price action might be categorized as a bearish consolidation phase. Moreover, oscillators on the daily chart are holding in the negative territory and are still far from being in the oversold zone. This, in turn, suggests that the path of least resistance for the XAG/USD is to the downside.
Bearish traders, however, might wait for some follow-through selling below the $22.85-$22.80 area or a multi-week low touched last Thursday, before placing fresh bets. The XAG/USD might then accelerate the fall towards challenging a strong horizontal support near the $22.20-$22.10 zone. This is followed by the $22.00 round-figure mark, which if broken decisively will be seen as a fresh trigger for bearish traders and pave the way for an extension of a multi-week-old descending trend.
On the flip side, the $23.20 region now seems to have emerged as an immediate strong resistance. Any subsequent move up might be seen as a selling opportunity and remain capped near the very important 200-day Simple Moving Average (SMA), currently pegged near the $23.45-$23.50 area. This is followed by the 100-day SMA barrier, around the $23.80 region, and the $24.00 mark, which if cleared should negate the near-term negative outlook for the XAG/USD.
The subsequent short-covering move has the potential to lift the white metal beyond the $24.30-$24.35 supply zone, towards reclaiming the $25.00 psychological mark. The latter represents the August monthly swing high and should act as a pivotal point. A sustained strength beyond will be seen as a fresh trigger for bullish traders and pave the way for some meaningful appreciating move for the XAG/USD.
Technical Levels: Supports and Resistances
XAGUSD currently trading at 23.04 at the time of writing. Pair opened at 23.08 and is trading with a change of -0.17 % .
| Overview | Overview.1 | |
|---|---|---|
| 0 | Today last price | 23.04 |
| 1 | Today Daily Change | -0.04 |
| 2 | Today Daily Change % | -0.17 |
| 3 | Today daily open | 23.08 |
The pair remains strongly bearish on the daily time frame. It trades below the 20 SMA @ 23.58, 50 SMA 23.74, 100 SMA @ 23.82 and 200 SMA @ 23.47.
| Trends | Trends.1 | |
|---|---|---|
| 0 | Daily SMA20 | 23.58 |
| 1 | Daily SMA50 | 23.74 |
| 2 | Daily SMA100 | 23.82 |
| 3 | Daily SMA200 | 23.47 |
The previous day high was 23.22 while the previous day low was 22.91. The daily 38.2% Fib levels comes at 23.1, expected to provide resistance. Similarly, the daily 61.8% fib level is at 23.03, expected to provide support.
Note the levels of interest below:
- Pivot support is noted at 22.92, 22.75, 22.6
- Pivot resistance is noted at 23.24, 23.39, 23.56
| Levels | Levels.1 |
|---|---|
| Previous Daily High | 23.22 |
| Previous Daily Low | 22.91 |
| Previous Weekly High | 24.30 |
| Previous Weekly Low | 22.83 |
| Previous Monthly High | 25.02 |
| Previous Monthly Low | 22.23 |
| Daily Fibonacci 38.2% | 23.10 |
| Daily Fibonacci 61.8% | 23.03 |
| Daily Pivot Point S1 | 22.92 |
| Daily Pivot Point S2 | 22.75 |
| Daily Pivot Point S3 | 22.60 |
| Daily Pivot Point R1 | 23.24 |
| Daily Pivot Point R2 | 23.39 |
| Daily Pivot Point R3 | 23.56 |
[/s2If]
Download Nehcap EAWe have two EAs that are operational on our LIVE accounts.
- EA-FIX: Check out the details here. Download EA-FIX . EA-FIX is a non-grid HFT scalper.
- EA-GROWTH: High quality low dd EA using trend grids. Download EA_GROWTHJoin Our Telegram Group


