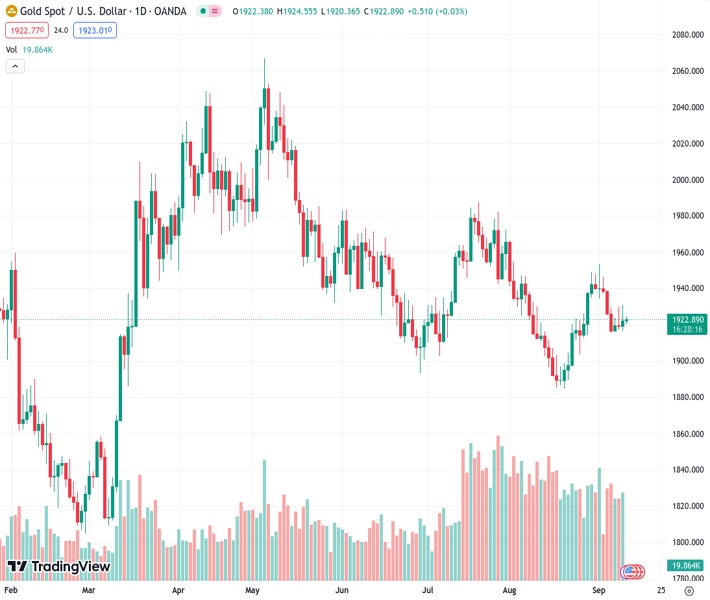
Gold is trading at 1,922.84 with a positive trend for the second consecutive day and remains above the 200-day Simple Moving Average (SMA).
…
This is a premium post.
[s2If !current_user_can(access_s2member_level4)]Please register for FREE REGISTER to read full post below containing analysis. In case of any error or you think you are not able to read the full post below, please email us at support#nehcap.com [lwa][/s2If] [s2If current_user_can(access_s2member_level1)]
- Gold price trades with a positive bias for the second straight day and holds above the 200-day SMA.
The pair currently trades last at 1922.84.
The previous day high was 1930.77 while the previous day low was 1916.64. The daily 38.2% Fib levels comes at 1925.37, expected to provide resistance. Similarly, the daily 61.8% fib level is at 1922.04, expected to provide support.
Gold price attracts some dip-buying in the vicinity of the very important 200-day Simple Moving Average (SMA) support during the Asian session on Tuesday and stalls the overnight pullback from the $1,930 area, or a four-day high. The XAU/USD currently trades around the $1,923 region, up slightly for the second successive day, though lacks bullish conviction as traders keenly await this week’s release of the latest consumer inflation figures from the United States (US) on Wednesday.
The crucial US Consumer Price Index (CPI) will provide fresh cues about the Federal Reserve’s (Fed) future rate hike path after the widely anticipated pause in September. A stronger US CPI print will reaffirm market bets for further policy tightening by the Fed, which, in turn, will set the stage for a fresh leg down for the non-yielding Gold price. It is worth mentioning that the markets have been pricing in the possibility of one more 25 basis points (bps) lift-off by the end of this year.
The expectations were lifted by the upbeat US macro data released last week, which pointed to a resilient economy and should allow the Fed to keep interest rates higher for longer. The hawkish outlook remains supportive of elevated US Treasury bond yields and had pushed the US Dollar (USD) to a six-month top last week. The Greenback, however, witnessed some profit-taking on Monday and languished near a multi-day low on Tuesday, lending some support to the Gold price.
Adding to this, the prevalent cautious mood around the equity markets is seen as another factor underpinning the precious metal’s safe-haven status. Market participants remain concerned about the worsening economic conditions in China – the world’s second-largest economy. This, along with worries about headwinds stemming from rapidly rising borrowing costs, tempers investors’ appetite for riskier assets and drives some haven flows towards the Gold price.
Traders, however, seem reluctant to place aggressive bullish bets and prefer to wait on the sidelines ahead of the US CPI report. This, along with the highly-anticipated European Central Bank (ECB) meeting on Thursday, should provide a fresh impetus to the Gold price. Analysts remain divided on whether the ECB will hike interest rates for a 10th straight time amid still-hight inflation or pause its historic policy-tightening cycle in the wake of a darkening Euro Zone economic outlook.
The key data/central bank event risk will help investors determine the next leg of a directional move for the Gold price. This, in turn, makes it prudent to wait for strong follow-through buying before positioning for the resumption of the recent recovery from the $1,885 region, or over a five-month trough touched in August.
Technical Levels: Supports and Resistances
XAUUSD currently trading at 1923.08 at the time of writing. Pair opened at 1922.42 and is trading with a change of 0.03 % .
| Overview | Overview.1 | |
|---|---|---|
| 0 | Today last price | 1923.08 |
| 1 | Today Daily Change | 0.66 |
| 2 | Today Daily Change % | 0.03 |
| 3 | Today daily open | 1922.42 |
The pair is trading above its 20 Daily moving average @ 1916.74, below its 50 Daily moving average @ 1932.22 , below its 100 Daily moving average @ 1949.99 and above its 200 Daily moving average @ 1919.5
| Trends | Trends.1 | |
|---|---|---|
| 0 | Daily SMA20 | 1916.74 |
| 1 | Daily SMA50 | 1932.22 |
| 2 | Daily SMA100 | 1949.99 |
| 3 | Daily SMA200 | 1919.50 |
The previous day high was 1930.77 while the previous day low was 1916.64. The daily 38.2% Fib levels comes at 1925.37, expected to provide resistance. Similarly, the daily 61.8% fib level is at 1922.04, expected to provide support.
Note the levels of interest below:
- Pivot support is noted at 1915.78, 1909.15, 1901.65
- Pivot resistance is noted at 1929.91, 1937.41, 1944.04
| Levels | Levels.1 |
|---|---|
| Previous Daily High | 1930.77 |
| Previous Daily Low | 1916.64 |
| Previous Weekly High | 1946.35 |
| Previous Weekly Low | 1915.33 |
| Previous Monthly High | 1966.08 |
| Previous Monthly Low | 1884.85 |
| Daily Fibonacci 38.2% | 1925.37 |
| Daily Fibonacci 61.8% | 1922.04 |
| Daily Pivot Point S1 | 1915.78 |
| Daily Pivot Point S2 | 1909.15 |
| Daily Pivot Point S3 | 1901.65 |
| Daily Pivot Point R1 | 1929.91 |
| Daily Pivot Point R2 | 1937.41 |
| Daily Pivot Point R3 | 1944.04 |
[/s2If]
Download Nehcap EAWe have two EAs that are operational on our LIVE accounts.
- EA-FIX: Check out the details here. Download EA-FIX . EA-FIX is a non-grid HFT scalper.
- EA-GROWTH: High quality low dd EA using trend grids. Download EA_GROWTHJoin Our Telegram Group


