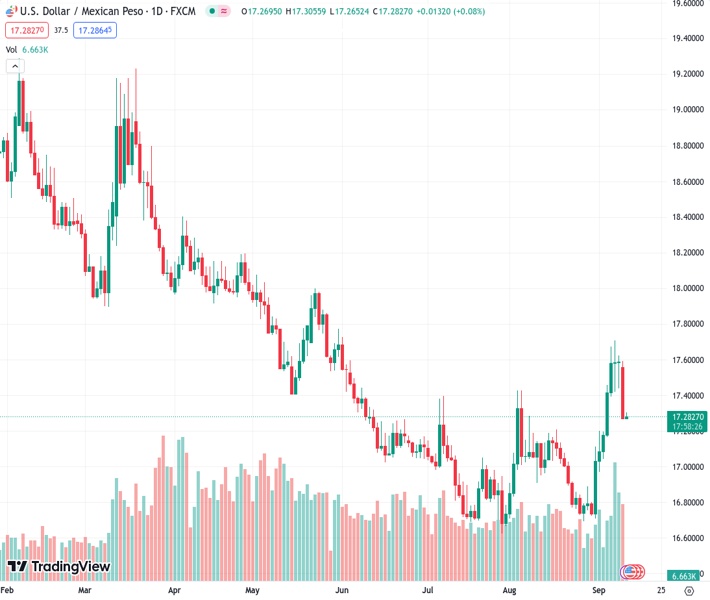
The USDMXN currency pair has halted its decline from a high point that occurred over several months, close to the support level of the 100-day Simple Moving Average (SMA).
…
This is a premium post.
[s2If !current_user_can(access_s2member_level4)]Please register for FREE REGISTER to read full post below containing analysis. In case of any error or you think you are not able to read the full post below, please email us at support#nehcap.com [lwa][/s2If] [s2If current_user_can(access_s2member_level1)]
- USD/MXN stalls its retracement slide from a multi-month top near the 100-day SMA support.
The pair currently trades last at 17.2794.
The previous day high was 17.5959 while the previous day low was 17.2722. The daily 38.2% Fib levels comes at 17.3959, expected to provide resistance. Similarly, the daily 61.8% fib level is at 17.4723, expected to provide resistance.
The USD/MXN pair finds some support near the 100-day Simple Moving Average (SMA), currently around the 17.25 region, and for now, seems to have stalled its retracement slide from over a three-month peak touched last week. Spot prices, however, struggle to register any meaningful recovery and remain below the 17.30 level through the Asian session.
From a technical perspective, the overnight sustained break and acceptance below the 38.2% Fibonacci retracement level of the recent rally from the August monthly swing low favours bearish traders. That said, oscillators on the daily chart –though have been easing from higher levels – are still holding in the positive territory. This, in turn, warrants some caution before positioning for any further depreciating move.
A convincing break below the 100-day SMA, however, might prompt some technical selling and expose the 50% Fibo. level, around the 17.20 level. The subsequent fall has the potential to drag the USD/MXN pair towards the 17.10 region, or the 61.8% Fibo. level. The latter should act as a key pivotal point, which if broken decisively could make spot prices vulnerable to extend the decline further below the 17.00 mark.
On the flip side, the 38.2% Fibo. level, around the 17.35 region, is likely to cap the immediate upside, above which the USD/MXN pair could climb to the 17.45-17.50 hurdle, or the 23.6% Fibo. level. This is followed by the multi-month top, around the 17.70 zone, which if cleared decisively will set the stage for the resumption of the recent strong appreciating move witnessed over the past two weeks or so.
Technical Levels: Supports and Resistances
USDMXN currently trading at 17.2819 at the time of writing. Pair opened at 17.2748 and is trading with a change of 0.04 % .
| Overview | Overview.1 | |
|---|---|---|
| 0 | Today last price | 17.2819 |
| 1 | Today Daily Change | 0.0071 |
| 2 | Today Daily Change % | 0.0400 |
| 3 | Today daily open | 17.2748 |
The pair is trading above its 20 Daily moving average @ 17.0924, above its 50 Daily moving average @ 17.0123 , above its 100 Daily moving average @ 17.2702 and below its 200 Daily moving average @ 18.0075
| Trends | Trends.1 | |
|---|---|---|
| 0 | Daily SMA20 | 17.0924 |
| 1 | Daily SMA50 | 17.0123 |
| 2 | Daily SMA100 | 17.2702 |
| 3 | Daily SMA200 | 18.0075 |
The previous day high was 17.5959 while the previous day low was 17.2722. The daily 38.2% Fib levels comes at 17.3959, expected to provide resistance. Similarly, the daily 61.8% fib level is at 17.4723, expected to provide resistance.
Note the levels of interest below:
- Pivot support is noted at 17.1661, 17.0573, 16.8424
- Pivot resistance is noted at 17.4898, 17.7047, 17.8135
| Levels | Levels.1 |
|---|---|
| Previous Daily High | 17.5959 |
| Previous Daily Low | 17.2722 |
| Previous Weekly High | 17.7094 |
| Previous Weekly Low | 17.0447 |
| Previous Monthly High | 17.4274 |
| Previous Monthly Low | 16.6945 |
| Daily Fibonacci 38.2% | 17.3959 |
| Daily Fibonacci 61.8% | 17.4723 |
| Daily Pivot Point S1 | 17.1661 |
| Daily Pivot Point S2 | 17.0573 |
| Daily Pivot Point S3 | 16.8424 |
| Daily Pivot Point R1 | 17.4898 |
| Daily Pivot Point R2 | 17.7047 |
| Daily Pivot Point R3 | 17.8135 |
[/s2If]
Download Nehcap EAWe have two EAs that are operational on our LIVE accounts.
- EA-FIX: Check out the details here. Download EA-FIX . EA-FIX is a non-grid HFT scalper.
- EA-GROWTH: High quality low dd EA using trend grids. Download EA_GROWTHJoin Our Telegram Group


