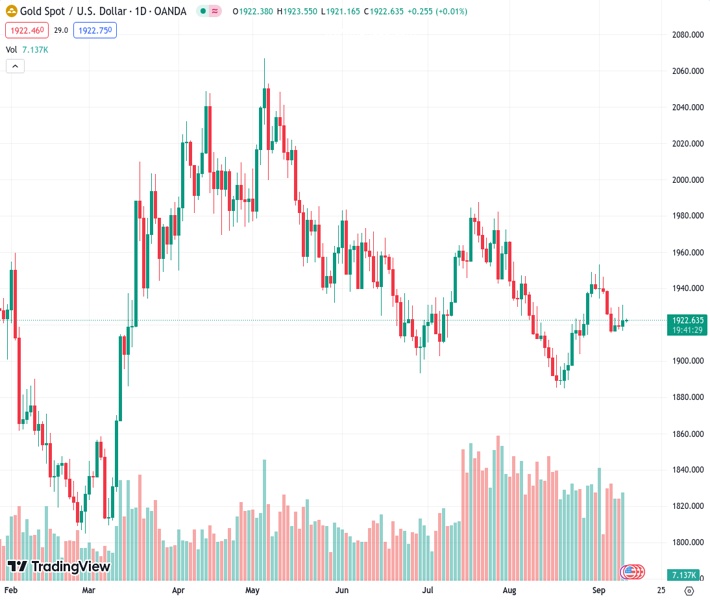
Gold prices have increased due to a decline in the US Dollar, with XAUUSD trading at 1,922.64.
…
This is a premium post.
[s2If !current_user_can(access_s2member_level4)]Please register for FREE REGISTER to read full post below containing analysis. In case of any error or you think you are not able to read the full post below, please email us at support#nehcap.com [lwa][/s2If] [s2If current_user_can(access_s2member_level1)]
- Gold prices trades higher on the pullback in US Dollar (USD).
The pair currently trades last at 1922.64.
The previous day high was 1930.77 while the previous day low was 1916.64. The daily 38.2% Fib levels comes at 1925.37, expected to provide resistance. Similarly, the daily 61.8% fib level is at 1922.04, expected to provide support.
XAU/USD attempts to extend gains on the second day, hovering around $1,921 during the early hours of the Asian session on Tuesday. The pair is experiencing upward support due to the pullback in the US Dollar (USD). However, the positive performance of US Treasury yields could be constraining the gains of the precious metal.
US Dollar Index (DXY) beats lower around 104.60, struggling to snap losses on the back of the positive performance of United States (US) bond yields. The yield on the 10-year US Treasury bond improved to 4.30% at the time of writing.
Strong economic releases in August exerted downward pressure on Gold prices. Although the labor market had shown deterioration in the past few weeks, it recently experienced a setback with two robust reports including the ISM Services PMI and Initial Jobless Claims, both surpassing market expectations. As long as the data continues to display a mixed outlook, market participants can expect the prices to consolidate.
Investors will likely watch the upcoming release of the US Consumer Price Index (CPI) data for August as it holds considerable significance before the September monetary policy meeting of the US Federal Reserve (Fed).
This data has the potential to offer additional insights into the country’s inflation scenario, which can significantly influence the investors’ outlook on the USD.
During the past week, Fed policymakers expressed strong support for maintaining the current policy stance on September 20. This stance is driven by declining inflation and a loosening labor market.
However, the appeal of Gold prices may be tempered in anticipation of a robust performance by the US Dollar (USD). The Greenback is anticipated to remain strong by absorbing the effects of higher interest rates more effectively. Moreover, the currency can be reinforced by further positive economic data from the US.
Investors have been pricing in the probability of a 25 basis points (bps) interest rate hike by the Fed, expected to occur in either the November or December meetings. This more hawkish tone has the potential to restrict the upward potential for Gold prices.
Technical Levels: Supports and Resistances
XAUUSD currently trading at 1921.6 at the time of writing. Pair opened at 1922.42 and is trading with a change of -0.04 % .
| Overview | Overview.1 | |
|---|---|---|
| 0 | Today last price | 1921.60 |
| 1 | Today Daily Change | -0.82 |
| 2 | Today Daily Change % | -0.04 |
| 3 | Today daily open | 1922.42 |
The pair is trading above its 20 Daily moving average @ 1916.74, below its 50 Daily moving average @ 1932.22 , below its 100 Daily moving average @ 1949.99 and above its 200 Daily moving average @ 1919.5
| Trends | Trends.1 | |
|---|---|---|
| 0 | Daily SMA20 | 1916.74 |
| 1 | Daily SMA50 | 1932.22 |
| 2 | Daily SMA100 | 1949.99 |
| 3 | Daily SMA200 | 1919.50 |
The previous day high was 1930.77 while the previous day low was 1916.64. The daily 38.2% Fib levels comes at 1925.37, expected to provide resistance. Similarly, the daily 61.8% fib level is at 1922.04, expected to provide support.
Note the levels of interest below:
- Pivot support is noted at 1915.78, 1909.15, 1901.65
- Pivot resistance is noted at 1929.91, 1937.41, 1944.04
| Levels | Levels.1 |
|---|---|
| Previous Daily High | 1930.77 |
| Previous Daily Low | 1916.64 |
| Previous Weekly High | 1946.35 |
| Previous Weekly Low | 1915.33 |
| Previous Monthly High | 1966.08 |
| Previous Monthly Low | 1884.85 |
| Daily Fibonacci 38.2% | 1925.37 |
| Daily Fibonacci 61.8% | 1922.04 |
| Daily Pivot Point S1 | 1915.78 |
| Daily Pivot Point S2 | 1909.15 |
| Daily Pivot Point S3 | 1901.65 |
| Daily Pivot Point R1 | 1929.91 |
| Daily Pivot Point R2 | 1937.41 |
| Daily Pivot Point R3 | 1944.04 |
[/s2If]
Download Nehcap EAWe have two EAs that are operational on our LIVE accounts.
- EA-FIX: Check out the details here. Download EA-FIX . EA-FIX is a non-grid HFT scalper.
- EA-GROWTH: High quality low dd EA using trend grids. Download EA_GROWTHJoin Our Telegram Group


