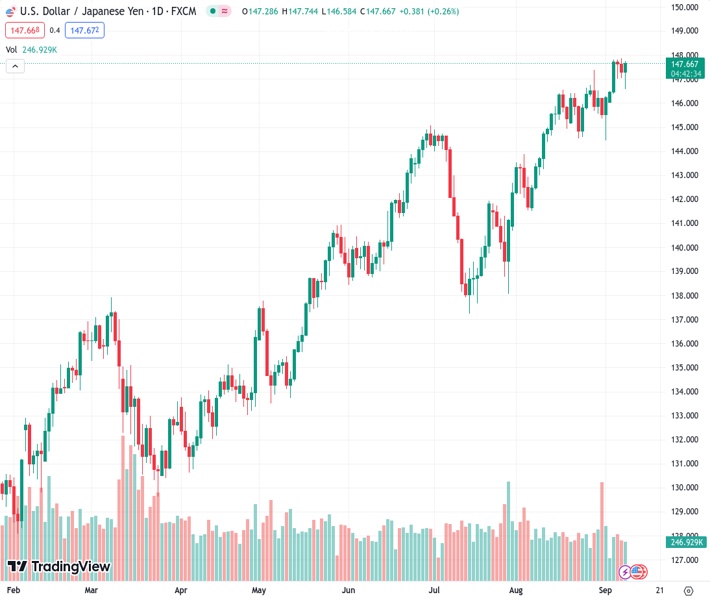
The USDJPY pair, currently trading at 147.669, experienced a slight increase of 0.30% as it moved closer to the 147.70 mark.
…
This is a premium post.
[s2If !current_user_can(access_s2member_level4)]Please register for FREE REGISTER to read full post below containing analysis. In case of any error or you think you are not able to read the full post below, please email us at support#nehcap.com [lwa][/s2If] [s2If current_user_can(access_s2member_level1)]
- USD/JPY rose towards 147.70, seeing 0.30%.
The pair currently trades last at 147.669.
The previous day high was 147.88 while the previous day low was 147.04. The daily 38.2% Fib levels comes at 147.36, expected to provide support. Similarly, the daily 61.8% fib level is at 147.56, expected to provide support.
The USD/JPY increased on Friday towards 147.70 after Japan reported soft data during the Asian session, and the pair is set to close a 1% weekly gain. On the USD side, it is retreating, consolidating its weekly gains, but the DXY index continues to trade at multi-month highs.
Datawise, no relevant data will be released for either country for the rest of the session. On the US side, the focus is on next week’s Consumer Price Index (CPI) figures from August, which will be important for the Federal Reserve (Fed) regarding the November and December decisions.
As for now, economic activity in the US has shown to remain resilient, driven by a strong Services sector, while the labour market, via the Nonfarm Payrolls, showed a mixed outlook, with job creation accelerating while wage inflation picked up in August. It’s worth reminding readers that the Federal Reserve (Fed) chairman Jerome Powell has stated that the bank expects the economy to cool down and that it will maintain its restrictive monetary policy as long as inflation does not back away.
According to the CME FedWatch tool, the odds for a 25 basis point (bps) hike in November and December stand near 40%, and rate cuts are seen between June and July 2024.
On the JPY’s side, the Japanese Cabinet Office revealed that the country’s Gross Domestic Product (GDP) growth for the second quarter was 1.2% on a quarterly basis, down from the previous reading of 1.5% and below expectations of 1.3%. On an annual basis, the growth rate was 4.8%, down from 6% and missing the market consensus of 5.5%. Lastly, Japanese Labor Cash Earnings for July, closely watched by the Bank of Japan, increased by 1.3%, matching expectations, but was lower than the 2.3% seen in the previous reading.
The BoJ has been lately signalling that unless wage and inflation figures meet their forecasts, they will maintain their dovish stance and monetary policy divergences may continue acting as a tailwind for the pair.
With both Relative Strength Index (RSI) and Moving Average Convergence Divergence (MACD) comfortably placed in positive territory on the daily chart, the USD/JPY buyers hold the upperhand. However, indicators are approaching overbought conditions, which could lead to a healthy technical correction in the near term. Moreover, the pair is above the 20,100,200-day Simple Moving Average (SMA), indicating a commanding position for the bulls in the bigger picture.
Support levels: 146.00, 144.80, 144.00.
Resistance levels: 148.00, 148.50, 149.00.
Technical Levels: Supports and Resistances
USDJPY currently trading at 147.7 at the time of writing. Pair opened at 147.3 and is trading with a change of 0.27 % .
| Overview | Overview.1 | |
|---|---|---|
| 0 | Today last price | 147.70 |
| 1 | Today Daily Change | 0.40 |
| 2 | Today Daily Change % | 0.27 |
| 3 | Today daily open | 147.30 |
The pair remains strongly bullish on the daily timeframe. It trades above its 20 SMA @ 146.12, 50 SMA 143.48, 100 SMA @ 141.04 and 200 SMA @ 137.02.
| Trends | Trends.1 | |
|---|---|---|
| 0 | Daily SMA20 | 146.12 |
| 1 | Daily SMA50 | 143.48 |
| 2 | Daily SMA100 | 141.04 |
| 3 | Daily SMA200 | 137.02 |
The previous day high was 147.88 while the previous day low was 147.04. The daily 38.2% Fib levels comes at 147.36, expected to provide support. Similarly, the daily 61.8% fib level is at 147.56, expected to provide support.
Note the levels of interest below:
- Pivot support is noted at 146.94, 146.57, 146.11
- Pivot resistance is noted at 147.77, 148.24, 148.6
| Levels | Levels.1 |
|---|---|
| Previous Daily High | 147.88 |
| Previous Daily Low | 147.04 |
| Previous Weekly High | 147.38 |
| Previous Weekly Low | 144.44 |
| Previous Monthly High | 147.38 |
| Previous Monthly Low | 141.51 |
| Daily Fibonacci 38.2% | 147.36 |
| Daily Fibonacci 61.8% | 147.56 |
| Daily Pivot Point S1 | 146.94 |
| Daily Pivot Point S2 | 146.57 |
| Daily Pivot Point S3 | 146.11 |
| Daily Pivot Point R1 | 147.77 |
| Daily Pivot Point R2 | 148.24 |
| Daily Pivot Point R3 | 148.60 |
[/s2If]
Download Nehcap EAWe have two EAs that are operational on our LIVE accounts.
- EA-FIX: Check out the details here. Download EA-FIX . EA-FIX is a non-grid HFT scalper.
- EA-GROWTH: High quality low dd EA using trend grids. Download EA_GROWTHJoin Our Telegram Group


