As the stock market in Wall Street begins on a positive note, the NZDUSD currency pair increases to 0.5907, marking a 0.57% rise. This partially counteracts concerns about a slowdown in the worldwide economy.
…
This is a premium post.
[s2If !current_user_can(access_s2member_level4)]Please register for FREE REGISTER to read full post below containing analysis. In case of any error or you think you are not able to read the full post below, please email us at support#nehcap.com [lwa][/s2If] [s2If current_user_can(access_s2member_level1)]
- As Wall Street opens positive, NZD/USD rises 0.57% to 0.5907, partially offsetting fears of a global economic slowdown.
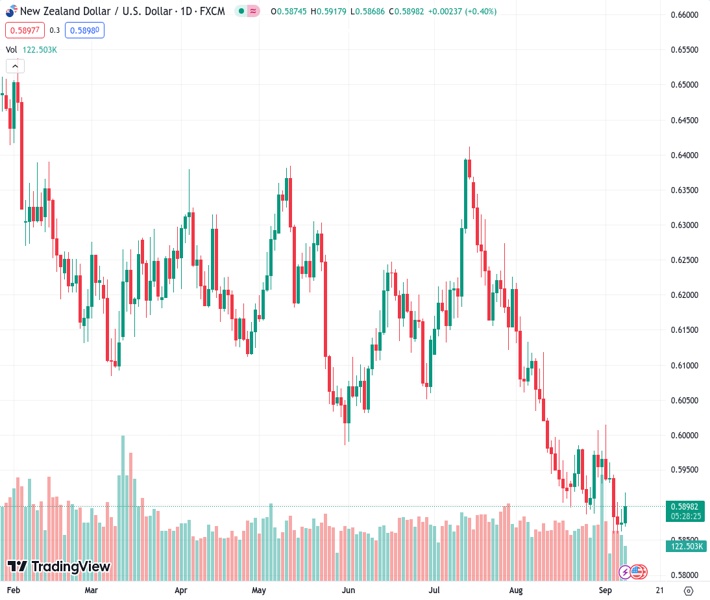
The pair currently trades last at 0.58981.
The previous day high was 0.5942 while the previous day low was 0.5862. The daily 38.2% Fib levels comes at 0.5911, expected to provide resistance. Similarly, the daily 61.8% fib level is at 0.5892, expected to provide support.
The New Zealand Dollar (NZD) stages a rebound against the US Dollar (USD), but it remains set to finish the week with losses. Fears of a global economic slowdown led by Europe and China dented investors’ mood during the European session, but Wall Street opened in the green. This bolstered the NZD/USD, which is trading at 0.5907, a gain of 0.57%.
The Greenback (USD) continues to soften after data propelled the buck to a six-month high, according to the US Dollar Index, at 105.057. Nevertheless, the lack of economic data in the US agenda and falling US Treasury bond yields weighed on the USD, a tailwind for the NZD/USD pair.
During the week, US data was positive for the buck, showing the economy’s resilience. Business activity in the services segment picked up, while the jobs market remains tight, as Initial Jobless claims show. However, the NZD/USD was propelled by Federal Reserve officials taking a more cautious stance, particularly Regional Fed Presidents Collins, Williams, and Bostic. Contrarily, the Chicago Fed President, Austan Goolsbee, adopted a more neutral stance, while Lorie Logan from the Dallas Fed said the US central bank needs to be data-dependant but added that more rate hikes are required to curb inflation.
In the meantime, the Kiwi has been influenced by market sentiment and negative data from China. As business activity in the latter struggled, despite Chinese authorities stimulating the economy, the financial markets had not bought that story, as the Chinese stock market was headed for weekly losses.
Aside from this, the NZD/USD would gather direction from next week’s data. The US agenda will feature inflation data, Retail Sales, unemployment claims, Industrial Production, and Consumer Sentiment from the University of Michigan. On the New Zealand front, Retail Card Spending.
The pair’s rally above the September 6 high of 0.5904 could be seen as an upward correction, but the overall trend remains downward. To shift the bias, buyers must reclaim the September 1 swing high of 0.6015, which would put the 50-day Moving Average (DMA) at 0.6080 in play. If the NZD/USD prints a daily close below 0.5904, sellers could drive the Kiwi/US Dollar pair toward the week’s lows at 0.5859 before challenging 0.5800.
Technical Levels: Supports and Resistances
NZDUSD currently trading at 0.5901 at the time of writing. Pair opened at 0.5875 and is trading with a change of 0.44 % .
| Overview | Overview.1 | |
|---|---|---|
| 0 | Today last price | 0.5901 |
| 1 | Today Daily Change | 0.0026 |
| 2 | Today Daily Change % | 0.4400 |
| 3 | Today daily open | 0.5875 |
The pair remains strongly bearish on the daily time frame. It trades below the 20 SMA @ 0.5935, 50 SMA 0.6085, 100 SMA @ 0.6126 and 200 SMA @ 0.6213.
| Trends | Trends.1 | |
|---|---|---|
| 0 | Daily SMA20 | 0.5935 |
| 1 | Daily SMA50 | 0.6085 |
| 2 | Daily SMA100 | 0.6126 |
| 3 | Daily SMA200 | 0.6213 |
The previous day high was 0.5942 while the previous day low was 0.5862. The daily 38.2% Fib levels comes at 0.5911, expected to provide resistance. Similarly, the daily 61.8% fib level is at 0.5892, expected to provide support.
Note the levels of interest below:
- Pivot support is noted at 0.5844, 0.5813, 0.5764
- Pivot resistance is noted at 0.5924, 0.5973, 0.6004
| Levels | Levels.1 |
|---|---|
| Previous Daily High | 0.5942 |
| Previous Daily Low | 0.5862 |
| Previous Weekly High | 0.6015 |
| Previous Weekly Low | 0.5887 |
| Previous Monthly High | 0.6219 |
| Previous Monthly Low | 0.5885 |
| Daily Fibonacci 38.2% | 0.5911 |
| Daily Fibonacci 61.8% | 0.5892 |
| Daily Pivot Point S1 | 0.5844 |
| Daily Pivot Point S2 | 0.5813 |
| Daily Pivot Point S3 | 0.5764 |
| Daily Pivot Point R1 | 0.5924 |
| Daily Pivot Point R2 | 0.5973 |
| Daily Pivot Point R3 | 0.6004 |
[/s2If]
Download Nehcap EAWe have two EAs that are operational on our LIVE accounts.
- EA-FIX: Check out the details here. Download EA-FIX . EA-FIX is a non-grid HFT scalper.
- EA-GROWTH: High quality low dd EA using trend grids. Download EA_GROWTHJoin Our Telegram Group


