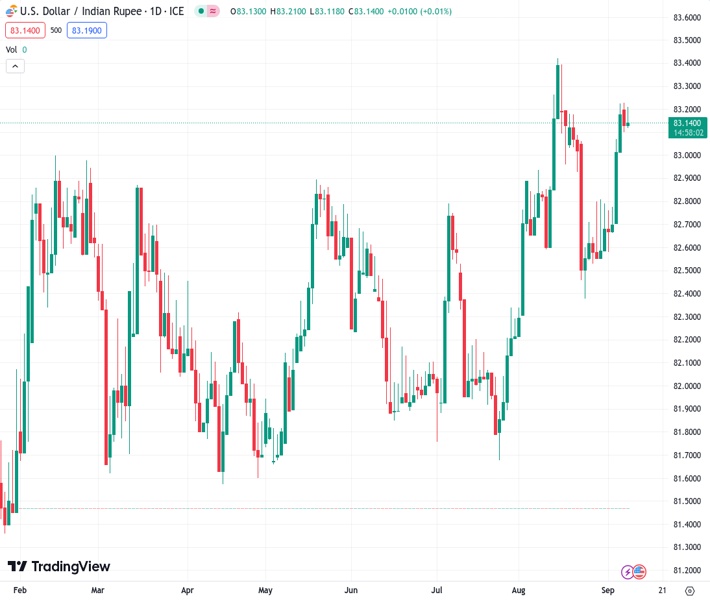
The USD to INR exchange rate of 83.1406 continued to decline for the second day in a row, but there was a lack of continued selling pressure.
…
This is a premium post.
[s2If !current_user_can(access_s2member_level4)]Please register for FREE REGISTER to read full post below containing analysis. In case of any error or you think you are not able to read the full post below, please email us at support#nehcap.com [lwa][/s2If] [s2If current_user_can(access_s2member_level1)]
- USD/INR drifts lower for the second successive day, albeit lacks follow-through selling.
The pair currently trades last at 83.1406.
The previous day high was 83.3348 while the previous day low was 83.0697. The daily 38.2% Fib levels comes at 83.1709, expected to provide resistance. Similarly, the daily 61.8% fib level is at 83.2335, expected to provide resistance.
The USD/INR pair remains under some selling pressure for the second successive day on Friday amid a modest US Dollar (USD) weakness, albeit manages to hold above the 83.00 mark heading into the European session.
The said handle represents a strong horizontal resistance breakpoint and should act as a pivotal point for intraday traders, which if broken might prompt some technical selling and pave the way for deeper losses. That said, oscillators on the daily chart are holding comfortably in the positive territory and are still far from being in the overbought zone. This, in turn, supports prospects for the emergence of some dip-buying at lower levels and should help limit any further losses for the USD/INR pair.
Some follow-through selling below the 82.85-82.80 region, however, might expose the weekly low, around the 82.60-82.55 zone. The next relevant support is pegged near the 82.35 area (August 24 low), which coincides with a technically significant 200-day Simple Moving Average (SMA). A convincing break below might shift the near-term bias in favour of bearish traders and make the USD/INR pair vulnerable to accelerate the slide towards retesting sub-82.00 levels.
On the flip side, the 83.35-83.40 area, or a three-week top touched on Wednesday, could now provide some resistance to the upside ahead of the record high, around the 83.55 region set on August 16. Bulls need to wait for a sustained strength beyond the latter before positioning for any further appreciating move. The subsequent move-up should allow the USD/INR bulls to aim to conquer the 84.00 round-figure mark.
Technical Levels: Supports and Resistances
USDINR currently trading at 83.1462 at the time of writing. Pair opened at 83.2444 and is trading with a change of -0.12 % .
| Overview | Overview.1 | |
|---|---|---|
| 0 | Today last price | 83.1462 |
| 1 | Today Daily Change | -0.0982 |
| 2 | Today Daily Change % | -0.1200 |
| 3 | Today daily open | 83.2444 |
The pair remains strongly bullish on the daily timeframe. It trades above its 20 SMA @ 82.9587, 50 SMA 82.5891, 100 SMA @ 82.3951 and 200 SMA @ 82.3213.
| Trends | Trends.1 | |
|---|---|---|
| 0 | Daily SMA20 | 82.9587 |
| 1 | Daily SMA50 | 82.5891 |
| 2 | Daily SMA100 | 82.3951 |
| 3 | Daily SMA200 | 82.3213 |
The previous day high was 83.3348 while the previous day low was 83.0697. The daily 38.2% Fib levels comes at 83.1709, expected to provide resistance. Similarly, the daily 61.8% fib level is at 83.2335, expected to provide resistance.
Note the levels of interest below:
- Pivot support is noted at 83.0979, 82.9512, 82.8328
- Pivot resistance is noted at 83.3629, 83.4814, 83.628
| Levels | Levels.1 |
|---|---|
| Previous Daily High | 83.3348 |
| Previous Daily Low | 83.0697 |
| Previous Weekly High | 82.8978 |
| Previous Weekly Low | 82.4635 |
| Previous Monthly High | 83.5505 |
| Previous Monthly Low | 82.2240 |
| Daily Fibonacci 38.2% | 83.1709 |
| Daily Fibonacci 61.8% | 83.2335 |
| Daily Pivot Point S1 | 83.0979 |
| Daily Pivot Point S2 | 82.9512 |
| Daily Pivot Point S3 | 82.8328 |
| Daily Pivot Point R1 | 83.3629 |
| Daily Pivot Point R2 | 83.4814 |
| Daily Pivot Point R3 | 83.6280 |
[/s2If]
Download Nehcap EAWe have two EAs that are operational on our LIVE accounts.
- EA-FIX: Check out the details here. Download EA-FIX . EA-FIX is a non-grid HFT scalper.
- EA-GROWTH: High quality low dd EA using trend grids. Download EA_GROWTHJoin Our Telegram Group


