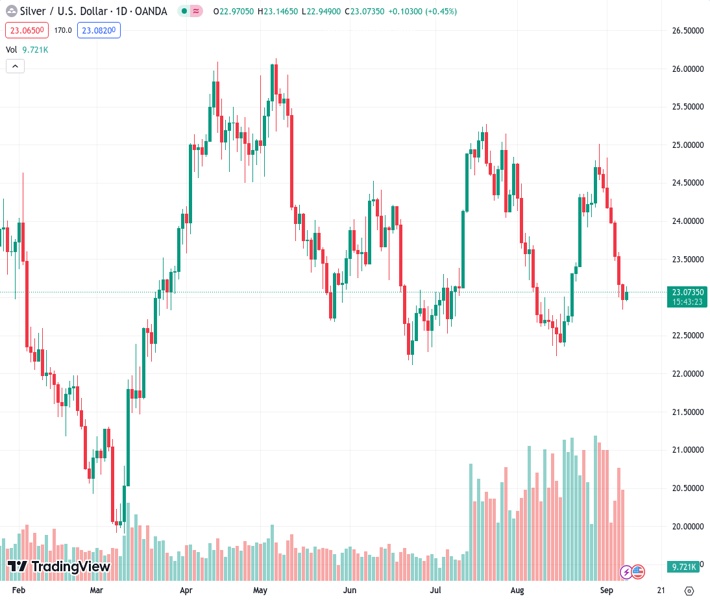
Silver’s value against the US dollar, represented by the symbol XAGUSD, improves and ends a period of decline lasting seven days, leading to a value not seen in over two weeks.
…
This is a premium post.
[s2If !current_user_can(access_s2member_level4)]Please register for FREE REGISTER to read full post below containing analysis. In case of any error or you think you are not able to read the full post below, please email us at support#nehcap.com [lwa][/s2If] [s2If current_user_can(access_s2member_level1)]
- Silver gains some positive traction and snaps a seven-day losing streak to over a two-week low.
The pair currently trades last at 22.983.
The previous day high was 23.19 while the previous day low was 22.83. The daily 38.2% Fib levels comes at 22.97, expected to provide support. Similarly, the daily 61.8% fib level is at 23.05, expected to provide resistance.
Silver attracts some buying during the Asian session on Friday and for now, seems to have snapped a seven-day losing streak to a two-and-half-week low, around the $22.85 region touched the previous day. The white metal currently trades just above the $23.00 mark, up over 0.40% for the day, though lacks bullish conviction and seems vulnerable to weaken further.
The outlook is reinforced by the fact that technical indicators on the daily chart have just started gaining negative traction, which supports prospects for the emergence of fresh selling at higher levels. Moreover, the Relative Strength Index (RSI) on the 4-hour chart has also recovered from the oversold territory. This, in turn, suggests that the path of least resistance for the XAG/USD is to the downside and any subsequent move up might still be seen as a selling opportunity.
Bearish traders, however, need to wait for some follow-through selling below the overnight swing low, around the $22.85 area, before placing fresh bets. The XAG/USD might then accelerate the downward trajectory below the $22.65-$22.60 support, towards challenging a strong horizontal support near the $22.20-$22.10 zone. This is followed by the $22.00 mark, which if broken will confirm a fresh breakdown and set the stage for an extension of the well-established downtrend.
On the flip side, the $23.35-$23.40 region is likely to act as an immediate hurdle ahead of the $23.65 area, representing the 100-period Simple Moving Average (SMA) on the 4-hour chart, which should act as a pivotal point. A sustained strength beyond will suggests that the recent downfall has run its course and shift the bias in favour of bullish traders. The subsequent short-covering move might then lift the XAG/USD to the $24.00 mark en route to the $24.30-$24.35 supply zone.
Technical Levels: Supports and Resistances
XAGUSD currently trading at 23.06 at the time of writing. Pair opened at 22.96 and is trading with a change of 0.44 % .
| Overview | Overview.1 | |
|---|---|---|
| 0 | Today last price | 23.06 |
| 1 | Today Daily Change | 0.10 |
| 2 | Today Daily Change % | 0.44 |
| 3 | Today daily open | 22.96 |
The pair remains strongly bearish on the daily time frame. It trades below the 20 SMA @ 23.55, 50 SMA 23.74, 100 SMA @ 23.86 and 200 SMA @ 23.47.
| Trends | Trends.1 | |
|---|---|---|
| 0 | Daily SMA20 | 23.55 |
| 1 | Daily SMA50 | 23.74 |
| 2 | Daily SMA100 | 23.86 |
| 3 | Daily SMA200 | 23.47 |
The previous day high was 23.19 while the previous day low was 22.83. The daily 38.2% Fib levels comes at 22.97, expected to provide support. Similarly, the daily 61.8% fib level is at 23.05, expected to provide resistance.
Note the levels of interest below:
- Pivot support is noted at 22.8, 22.64, 22.44
- Pivot resistance is noted at 23.16, 23.35, 23.51
| Levels | Levels.1 |
|---|---|
| Previous Daily High | 23.19 |
| Previous Daily Low | 22.83 |
| Previous Weekly High | 25.02 |
| Previous Weekly Low | 24.05 |
| Previous Monthly High | 25.02 |
| Previous Monthly Low | 22.23 |
| Daily Fibonacci 38.2% | 22.97 |
| Daily Fibonacci 61.8% | 23.05 |
| Daily Pivot Point S1 | 22.80 |
| Daily Pivot Point S2 | 22.64 |
| Daily Pivot Point S3 | 22.44 |
| Daily Pivot Point R1 | 23.16 |
| Daily Pivot Point R2 | 23.35 |
| Daily Pivot Point R3 | 23.51 |
[/s2If]
Download Nehcap EAWe have two EAs that are operational on our LIVE accounts.
- EA-FIX: Check out the details here. Download EA-FIX . EA-FIX is a non-grid HFT scalper.
- EA-GROWTH: High quality low dd EA using trend grids. Download EA_GROWTHJoin Our Telegram Group


